

Question: Exercise based off of chapter 9 Lloyd, Robert C. Quality Health Care: a Guide to Developing and Using Indicators. Jones Et Bartlett Learning, 2019. 246
Exercise based off of chapter 9 Lloyd, Robert C. Quality Health Care: a Guide to Developing and Using Indicators. Jones Et Bartlett Learning, 2019.
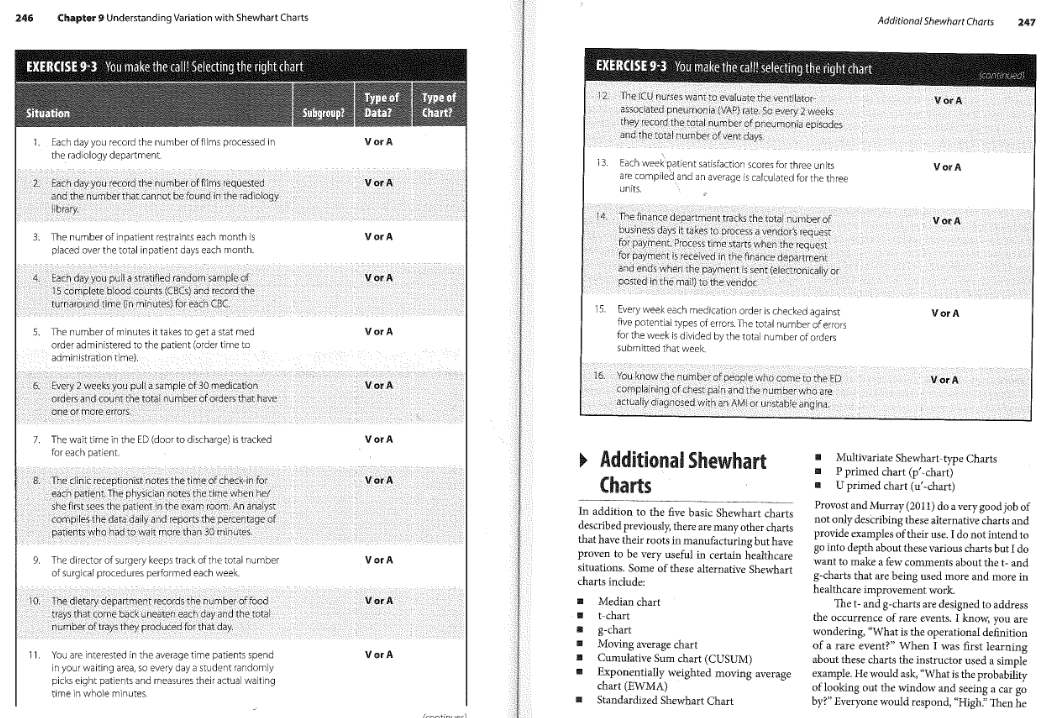
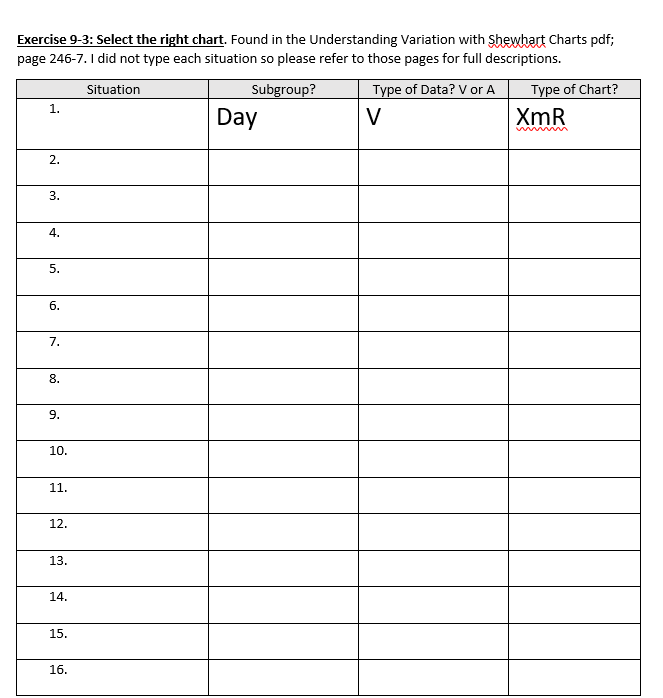
246 Chapter 9 Understanding Variation with Shewhart Charts Additional Shewhart Charts 247 EXERCISE 9-3 You make the call! Selecting the right chart EXERCISE 9-3 You make the call! selecting the right chart conced Type of Data? Vor A Type of Chart? Situation Subgroup? 12 The ICU nurses want to evaluate the ventilator associated pneumonia (VAP) rate. So every 2 weeks they record the total number of pneumonia episodes and the total number of vent days Vor A 1. Each day you record the number of films processed in the radiology department Vor A 13. Each week patient satisfaction scores for three units are compiled and an average is calculated for the three units 2 Each day you record the number of films requested and the number that cannot be found in the radiology library Vor A Vor A V or A 3. The number of inpatient restraints each month is placed over the total inpatient days each month . 14. The finance department tracks the total number of business days it takes to process a vendor's request for payment. Process time starts when the request for payment is received in the finance department and ends when the payment is sent (electronically on posted in the mail) to the vendor Vor A 4. Each day you pulla stratifled random sample of 15 complete blood counts (CBC) and record the turnaround time Un minutes) for each CBC. Vor A Vor A 5. The number of minutes it takes to get a stat med order administered to the patient (order time to administration time). 15. Every week each medication order is checked against five potential types of errors. The total number of errors for the week is divided by the total number of orders submitted that week, V or A 6. Vor A Every 2 weeks you pull a sample of 30 medication orders and count the total number of orders that have one or more errors 16. You know the rumber of people who come to the ED complaining of chest pain and the number who are actually diagnosed with an AMI or unstable angina 7. Vor A The wait time in the ED (door to discharge) is tracked for each patient. Vor A 8. The clinic receptionist notes the time of check in for each patient The physician notes the time when hel she first sees the patient in the exam room An analyst compiles the data daily and reports the percentage of patients who had to wait more than 30 minutes. Vor A 9. The director of surgery keeps track of the total number of surgical procedures performed each week Additional Shewhart - Multivariate Shewhart-type Charts P primed chart (p-chart) Charts U primed chart (u'-chart) Provost and Murray (2011) do a very good job of In addition to the five basic Shewhart charts described previously, there are many other charts not only describing these alternative charts and that have their roots in manufacturing but have provide examples of their use. I do not intend to go into depth about these various charts but I do proven to be very useful in certain healthcare want to make a few comments about the t-and situations. Some of these alternative Shewhart g-charts that are being used more and more in charts include: healthcare improvement work Median chart The t-and g-charts are designed to address t-chart the occurrence of rare events. I know, you are 8-chart wondering "What is the operational definition . Moving average chart of a rare event?" When I was first learning Cumulative Sum chart (CUSUM) about these charts the instructor used a simple Exponentially weighted moving average example. He would ask, "What is the probability chart (EWMA) of looking out the window and seeing a car go Standardized Shewhart Chart by?" Everyone would respond, "High" Then he Vor A 10. The dietary department records the number of food trays that come backuneaten each day and the total number of trays they produced for that day. 11 Vor A You are interested in the average time patients spend in your waiting area, so every day a student randomly picks eight patients and measures their actual waiting time in whole minutes mantini Exercise 9-3: Select the right chart. Found in the Understanding Variation with Shewhart Charts pdf; page 246-7. I did not type each situation so please refer to those pages for full descriptions. Situation Subgroup? Type of Data? V or A Type of Chart? 1. Day V XmR 2. 3. 4. 5. 6. 7. 8. 9. 10. 11. 12. 13. 14. 15. 16. 246 Chapter 9 Understanding Variation with Shewhart Charts Additional Shewhart Charts 247 EXERCISE 9-3 You make the call! Selecting the right chart EXERCISE 9-3 You make the call! selecting the right chart conced Type of Data? Vor A Type of Chart? Situation Subgroup? 12 The ICU nurses want to evaluate the ventilator associated pneumonia (VAP) rate. So every 2 weeks they record the total number of pneumonia episodes and the total number of vent days Vor A 1. Each day you record the number of films processed in the radiology department Vor A 13. Each week patient satisfaction scores for three units are compiled and an average is calculated for the three units 2 Each day you record the number of films requested and the number that cannot be found in the radiology library Vor A Vor A V or A 3. The number of inpatient restraints each month is placed over the total inpatient days each month . 14. The finance department tracks the total number of business days it takes to process a vendor's request for payment. Process time starts when the request for payment is received in the finance department and ends when the payment is sent (electronically on posted in the mail) to the vendor Vor A 4. Each day you pulla stratifled random sample of 15 complete blood counts (CBC) and record the turnaround time Un minutes) for each CBC. Vor A Vor A 5. The number of minutes it takes to get a stat med order administered to the patient (order time to administration time). 15. Every week each medication order is checked against five potential types of errors. The total number of errors for the week is divided by the total number of orders submitted that week, V or A 6. Vor A Every 2 weeks you pull a sample of 30 medication orders and count the total number of orders that have one or more errors 16. You know the rumber of people who come to the ED complaining of chest pain and the number who are actually diagnosed with an AMI or unstable angina 7. Vor A The wait time in the ED (door to discharge) is tracked for each patient. Vor A 8. The clinic receptionist notes the time of check in for each patient The physician notes the time when hel she first sees the patient in the exam room An analyst compiles the data daily and reports the percentage of patients who had to wait more than 30 minutes. Vor A 9. The director of surgery keeps track of the total number of surgical procedures performed each week Additional Shewhart - Multivariate Shewhart-type Charts P primed chart (p-chart) Charts U primed chart (u'-chart) Provost and Murray (2011) do a very good job of In addition to the five basic Shewhart charts described previously, there are many other charts not only describing these alternative charts and that have their roots in manufacturing but have provide examples of their use. I do not intend to go into depth about these various charts but I do proven to be very useful in certain healthcare want to make a few comments about the t-and situations. Some of these alternative Shewhart g-charts that are being used more and more in charts include: healthcare improvement work Median chart The t-and g-charts are designed to address t-chart the occurrence of rare events. I know, you are 8-chart wondering "What is the operational definition . Moving average chart of a rare event?" When I was first learning Cumulative Sum chart (CUSUM) about these charts the instructor used a simple Exponentially weighted moving average example. He would ask, "What is the probability chart (EWMA) of looking out the window and seeing a car go Standardized Shewhart Chart by?" Everyone would respond, "High" Then he Vor A 10. The dietary department records the number of food trays that come backuneaten each day and the total number of trays they produced for that day. 11 Vor A You are interested in the average time patients spend in your waiting area, so every day a student randomly picks eight patients and measures their actual waiting time in whole minutes mantini Exercise 9-3: Select the right chart. Found in the Understanding Variation with Shewhart Charts pdf; page 246-7. I did not type each situation so please refer to those pages for full descriptions. Situation Subgroup? Type of Data? V or A Type of Chart? 1. Day V XmR 2. 3. 4. 5. 6. 7. 8. 9. 10. 11. 12. 13. 14. 15. 16Step by Step Solution
There are 3 Steps involved in it
1 Expert Approved Answer
Step: 1 Unlock

Question Has Been Solved by an Expert!
Get step-by-step solutions from verified subject matter experts
Step: 2 Unlock
Step: 3 Unlock