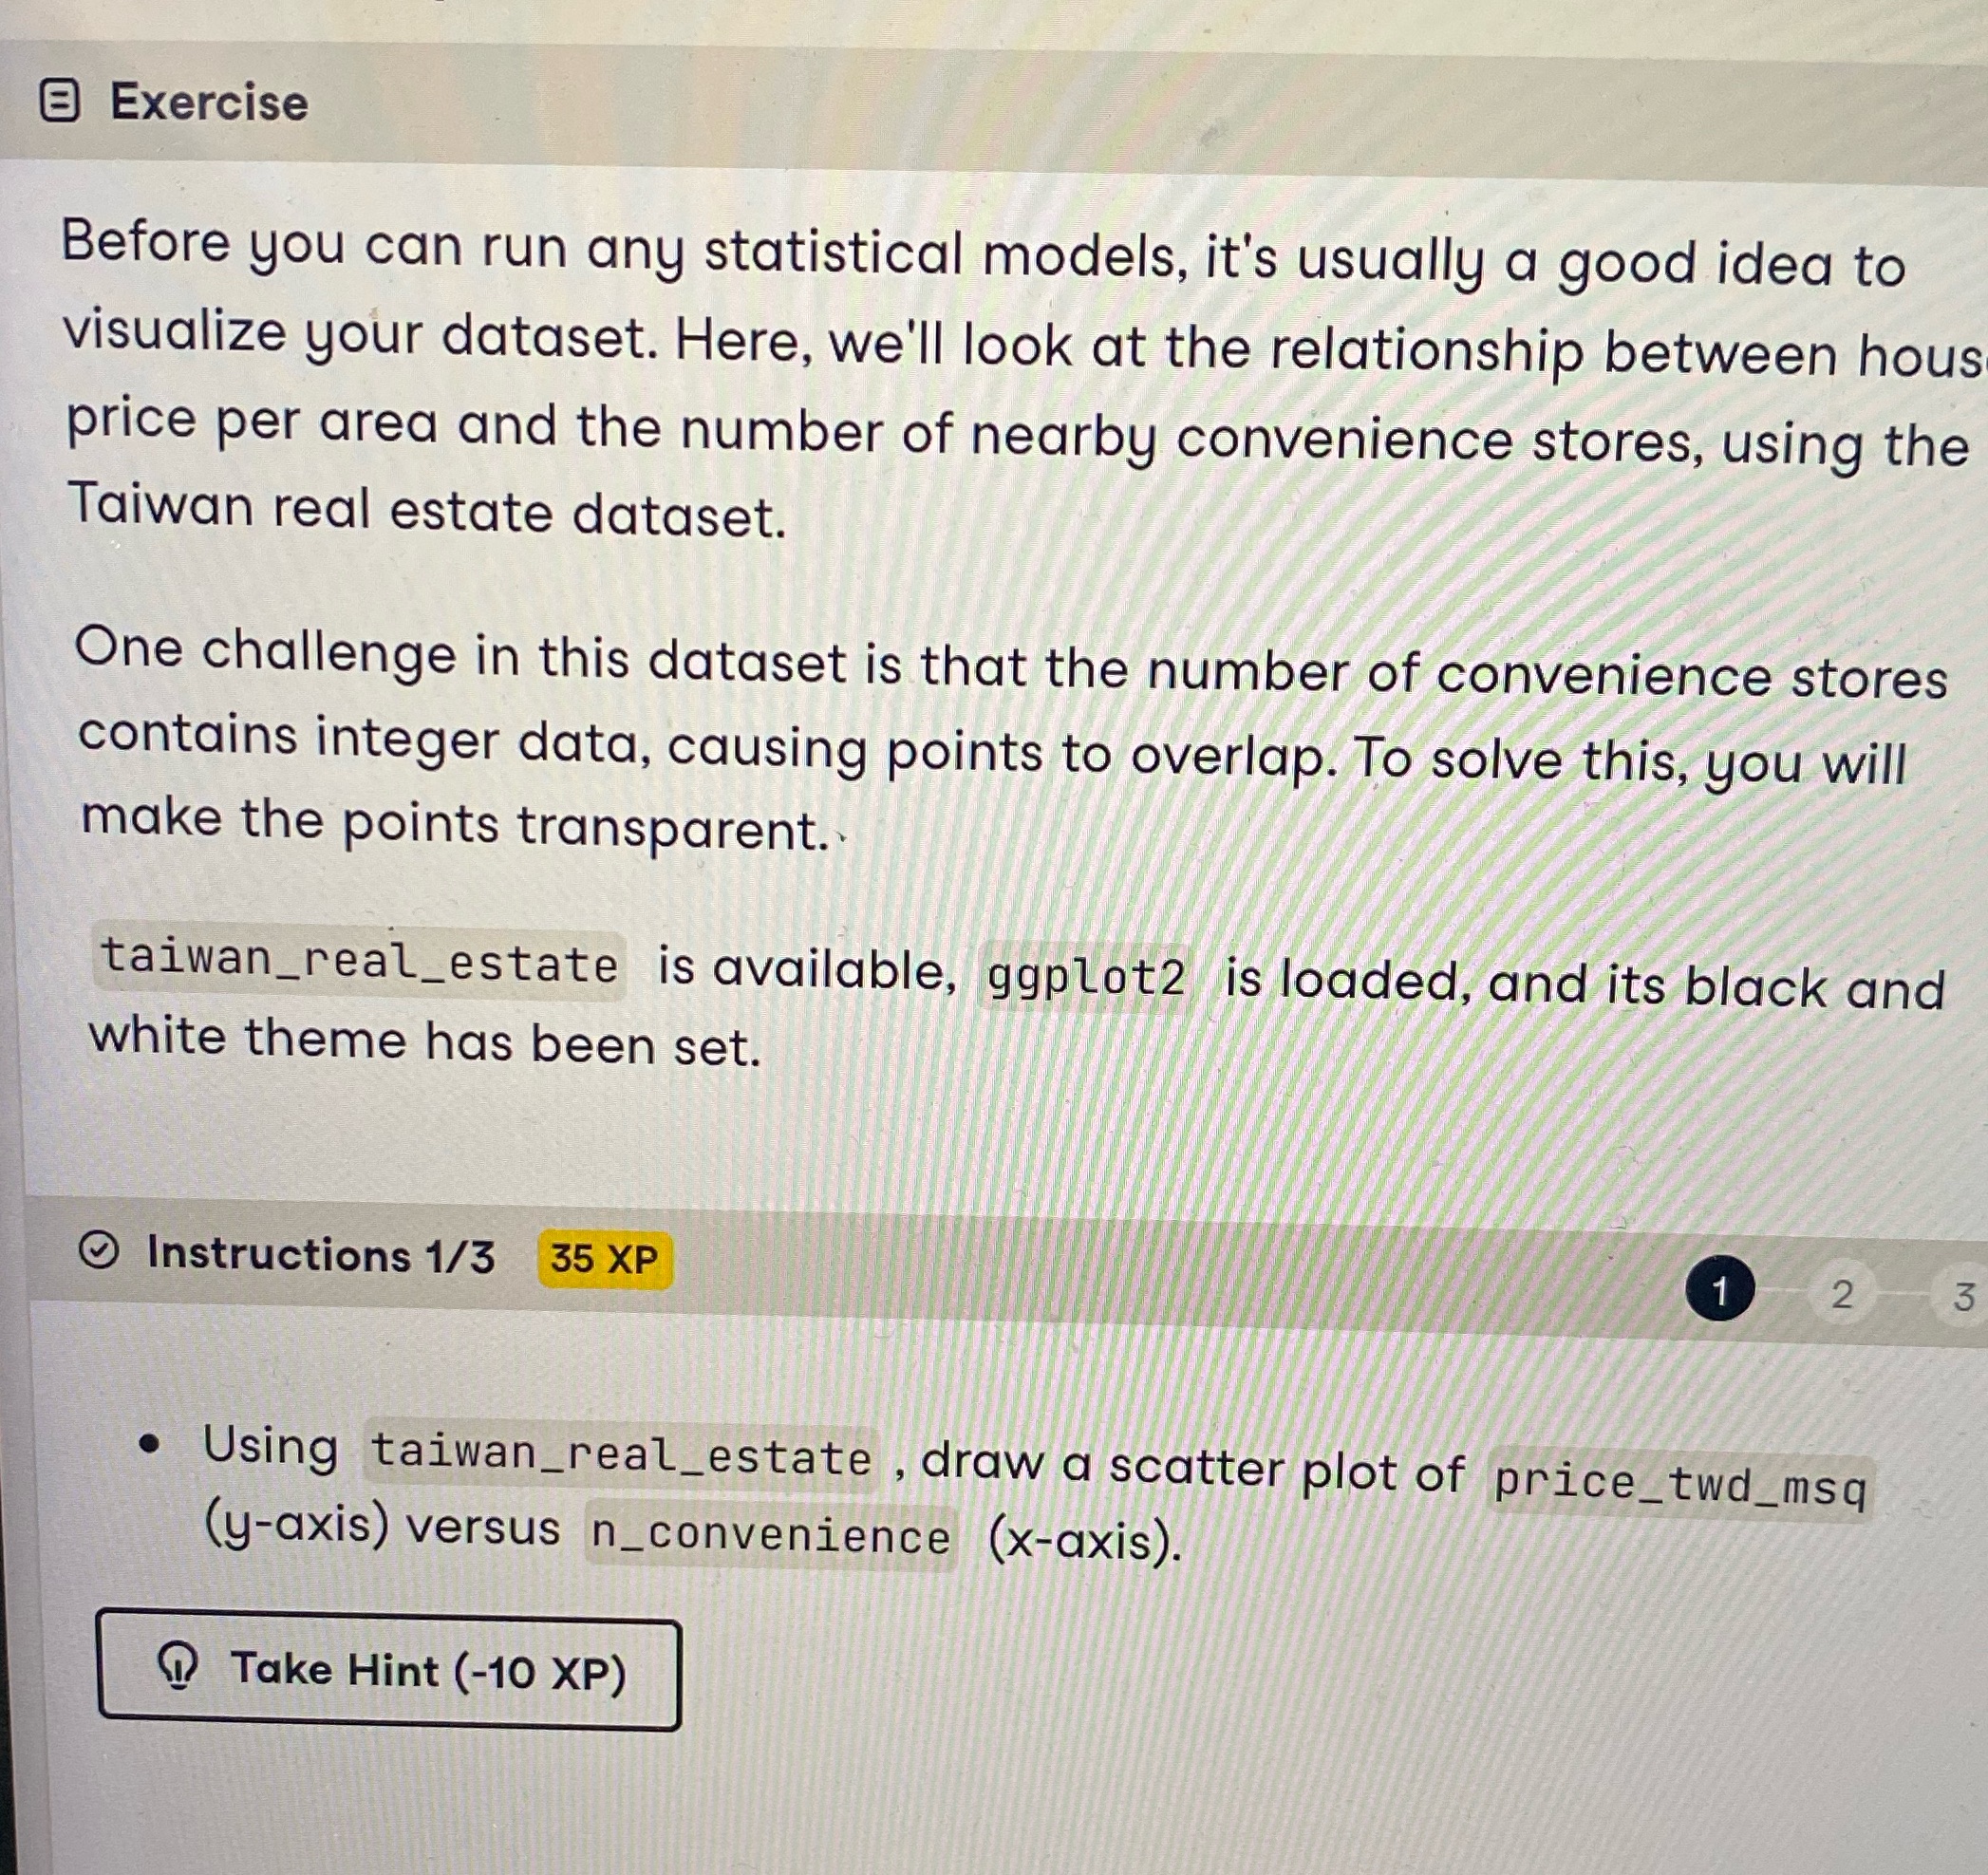
Question: Exercise Before you can run any statistical models, it's usually a good idea to visualize your dataset. Here, we'll look at the relationship between hous

Exercise Before you can run any statistical
Exercise Before you can run any statistical models, it's usually a good idea to visualize your dataset. Here, we'll look at the relationship between hous price per area and the number of nearby convenience stores, using the Taiwan real estate dataset. One challenge in this dataset is that the number of convenience stores contains integer data, causing points to overlap. To solve this, you will make the points transparent. taiwan_real_estate is available, ggplot2 is loaded, and its black and white theme has been set. Instructions 1/3 35 XP 2 3 . Using taiwan_real_estate , draw a scatter plot of price_two_msq (y-axis) versus n_convenience (x-axis). Take Hint (-10 XP)

Step by Step Solution

There are 3 Steps involved in it

1 Expert Approved Answer
Step: 1 Unlock blur-text-image
Question Has Been Solved by an Expert!

Get step-by-step solutions from verified subject matter experts

Step: 2 Unlock
Step: 3 Unlock

Students Have Also Explored These Related Accounting Questions!