

Question: Exercise MC _ 1 - EBIT function in the CVP Model: comparison of two companies The following table contains essential economic data from two different
Exercise MC EBIT function in the CVP Model: comparison of two companies
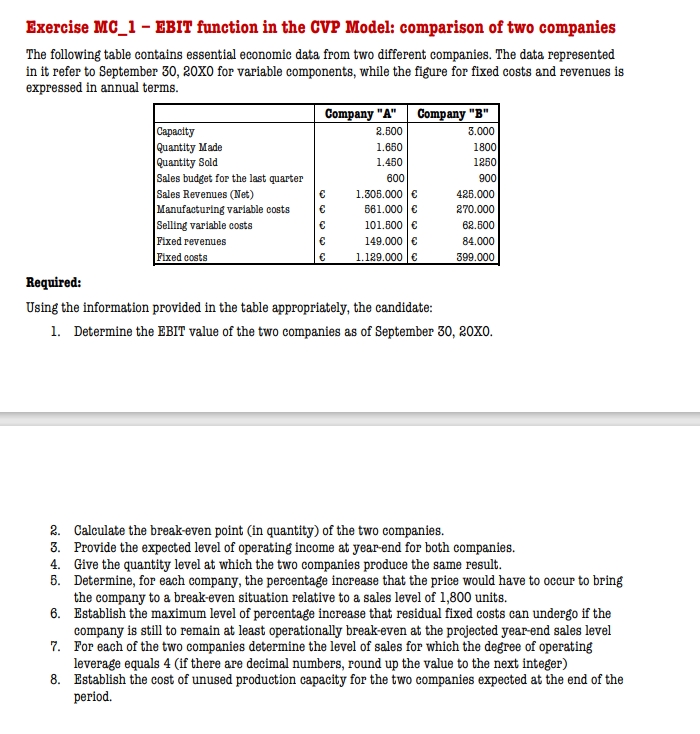
The following table contains essential economic data from two different companies. The data represented
in it refer to September X for variable components, while the figure for fixed costs and revenues is
expressed in annual terms.
Required:
Using the information provided in the table appropriately, the candidate:
Determine the EBIT value of the two companies as of September X
Calculate the breakeven point in quantity of the two companies.
Provide the expected level of operating income at yearend for both companies.
Give the quantity level at which the two companies produce the same result.
B Determine, for each company, the percentage increase that the price would have to occur to bring
the company to a breakeven situation relative to a sales level of units.
Establish the maximum level of percentage increase that residual fixed costs can undergo if the
company is still to remain at least operationally breakeven at the projected yearend sales level
For each of the two companies determine the level of sales for which the degree of operating
leverage equals if there are decimal numbers, round up the value to the next integer
Establish the cost of unused production capacity for the two companies expected at the end of the
period.
Step by Step Solution
There are 3 Steps involved in it
1 Expert Approved Answer
Step: 1 Unlock

Question Has Been Solved by an Expert!
Get step-by-step solutions from verified subject matter experts
Step: 2 Unlock
Step: 3 Unlock