

Question: Exercise - Misclassification of Exposure The data in Table 1 contains results in the source population (gold standard) from a case-contro study of stroke and
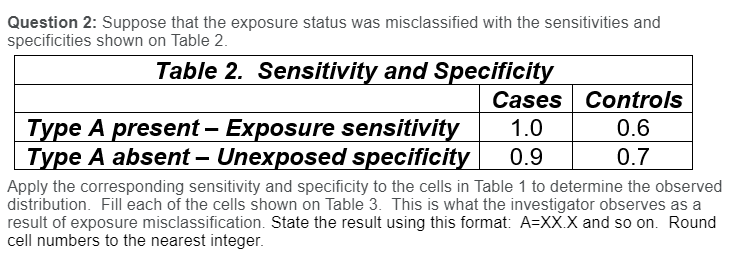
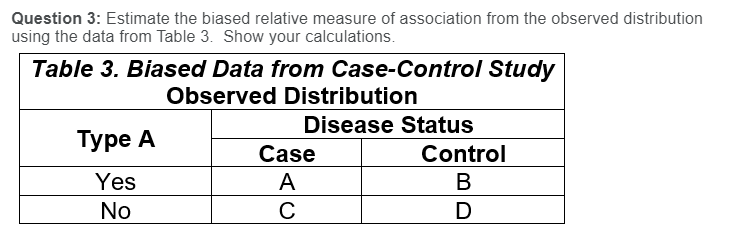
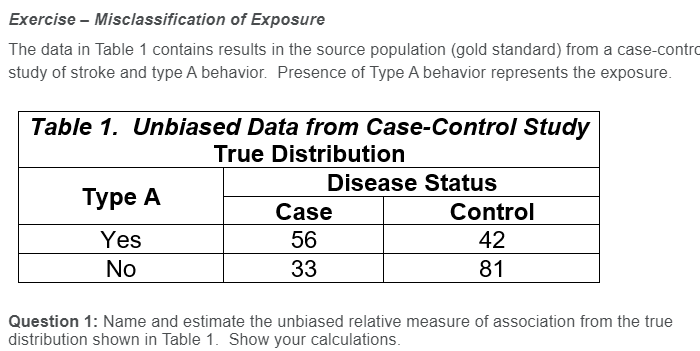


Exercise - Misclassification of Exposure The data in Table 1 contains results in the source population (gold standard) from a case-contro study of stroke and type A behavior. Presence of Type A behavior represents the exposure. Table 1. Unbiased Data from Case-Control Study True Distribution Disease Status Type A Case Control Yes 56 42 No 33 81 Question 1: Name and estimate the unbiased relative measure of association from the true distribution shown in Table 1. Show your calculations.Question 2: Suppose that the exposure status was misclassified with the sensitivities and specificities shown on Table 2. Table 2. Sensitivity and Specificity Cases Controls Type A present - Exposure sensitivity 1.0 0.6 Type A absent - Unexposed specificity 0.9 0.7 Apply the corresponding sensitivity and specificity to the cells in Table 1 to determine the observed distribution. Fill each of the cells shown on Table 3. This is what the investigator observes as a result of exposure misclassification. State the result using this format: A=XX.X and so on. Round cell numbers to the nearest integer.Question 3: Estimate the biased relative measure of association from the observed distribution using the data from Table 3. Show your calculations. Table 3. Biased Data from Case-Control Study Observed Distribution Disease Status Type A Case Control Yes A B No C D
Step by Step Solution
There are 3 Steps involved in it

Get step-by-step solutions from verified subject matter experts