

Question: Exercise1 Selected comparative financial statement data for Sari inc. Balance Sheet (En milliers de dollars) 2018 Assets 2017 Assets CT -Cash - Accounts Receivable -
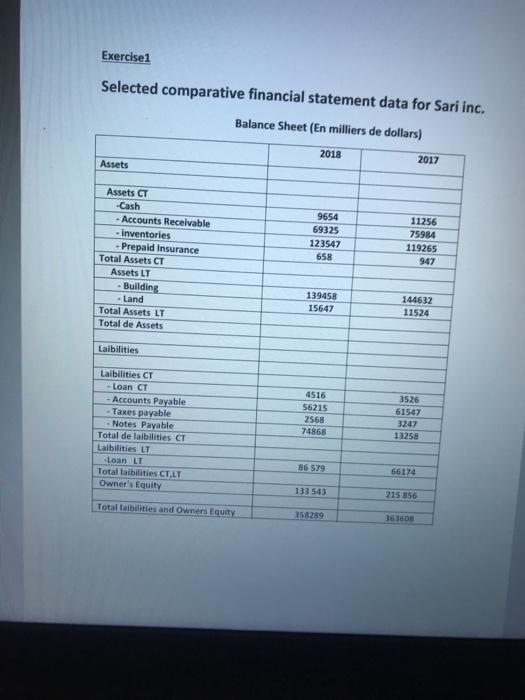
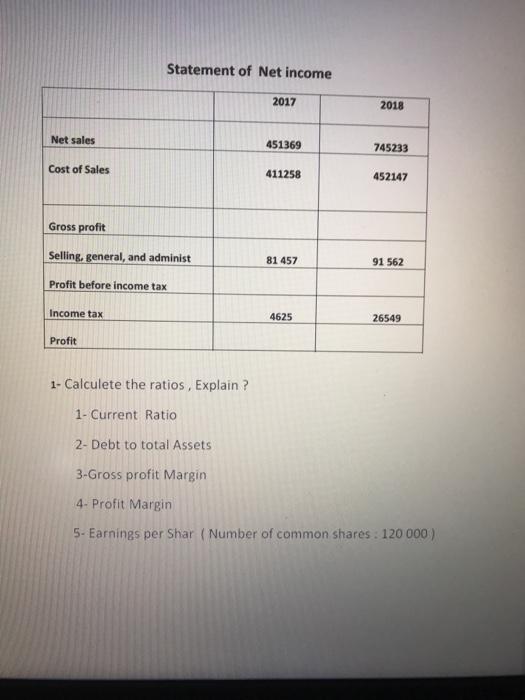
Exercise1 Selected comparative financial statement data for Sari inc. Balance Sheet (En milliers de dollars) 2018 Assets 2017 Assets CT -Cash - Accounts Receivable - Inventories - Prepaid Insurance Total Assets CT Assets LT Building - Land Total Assets LT Total de Assets 9654 69325 123547 658 11256 75984 119265 947 139458 15647 144632 11524 Laibilities Laibilities CT Loan CT - Accounts Payable - Taxes payable - Notes Payable Total de laibilitie CT Laibilities LT Loan LT Total laibilities CT.LT Owner's Equity 4516 56215 2568 74868 3526 61547 3247 13258 86 579 66174 133543 215 56 Total abilities and Owners Equity 358289 36 1608 Statement of Net income 2017 2018 Net sales 451369 745233 Cost of Sales 411258 452147 Gross profit Selling, general, and administ 81 457 91 562 Profit before income tax Income tax 4625 26549 Profit 1- Calculete the ratios , Explain? 1- Current Ratio 2- Debt to total Assets 3-Gross profit Margin 4. Profit Margin 5- Earnings per Shar (Number of common shares : 120 000)
Step by Step Solution
There are 3 Steps involved in it

Get step-by-step solutions from verified subject matter experts