

Question: Exercisen 1 In - Class Lab & Homework Assignments Below are car sales by time ( dependent varlable ) by time ( Independent varlable )
Exercisen
InClass Lab & Homework Assignments
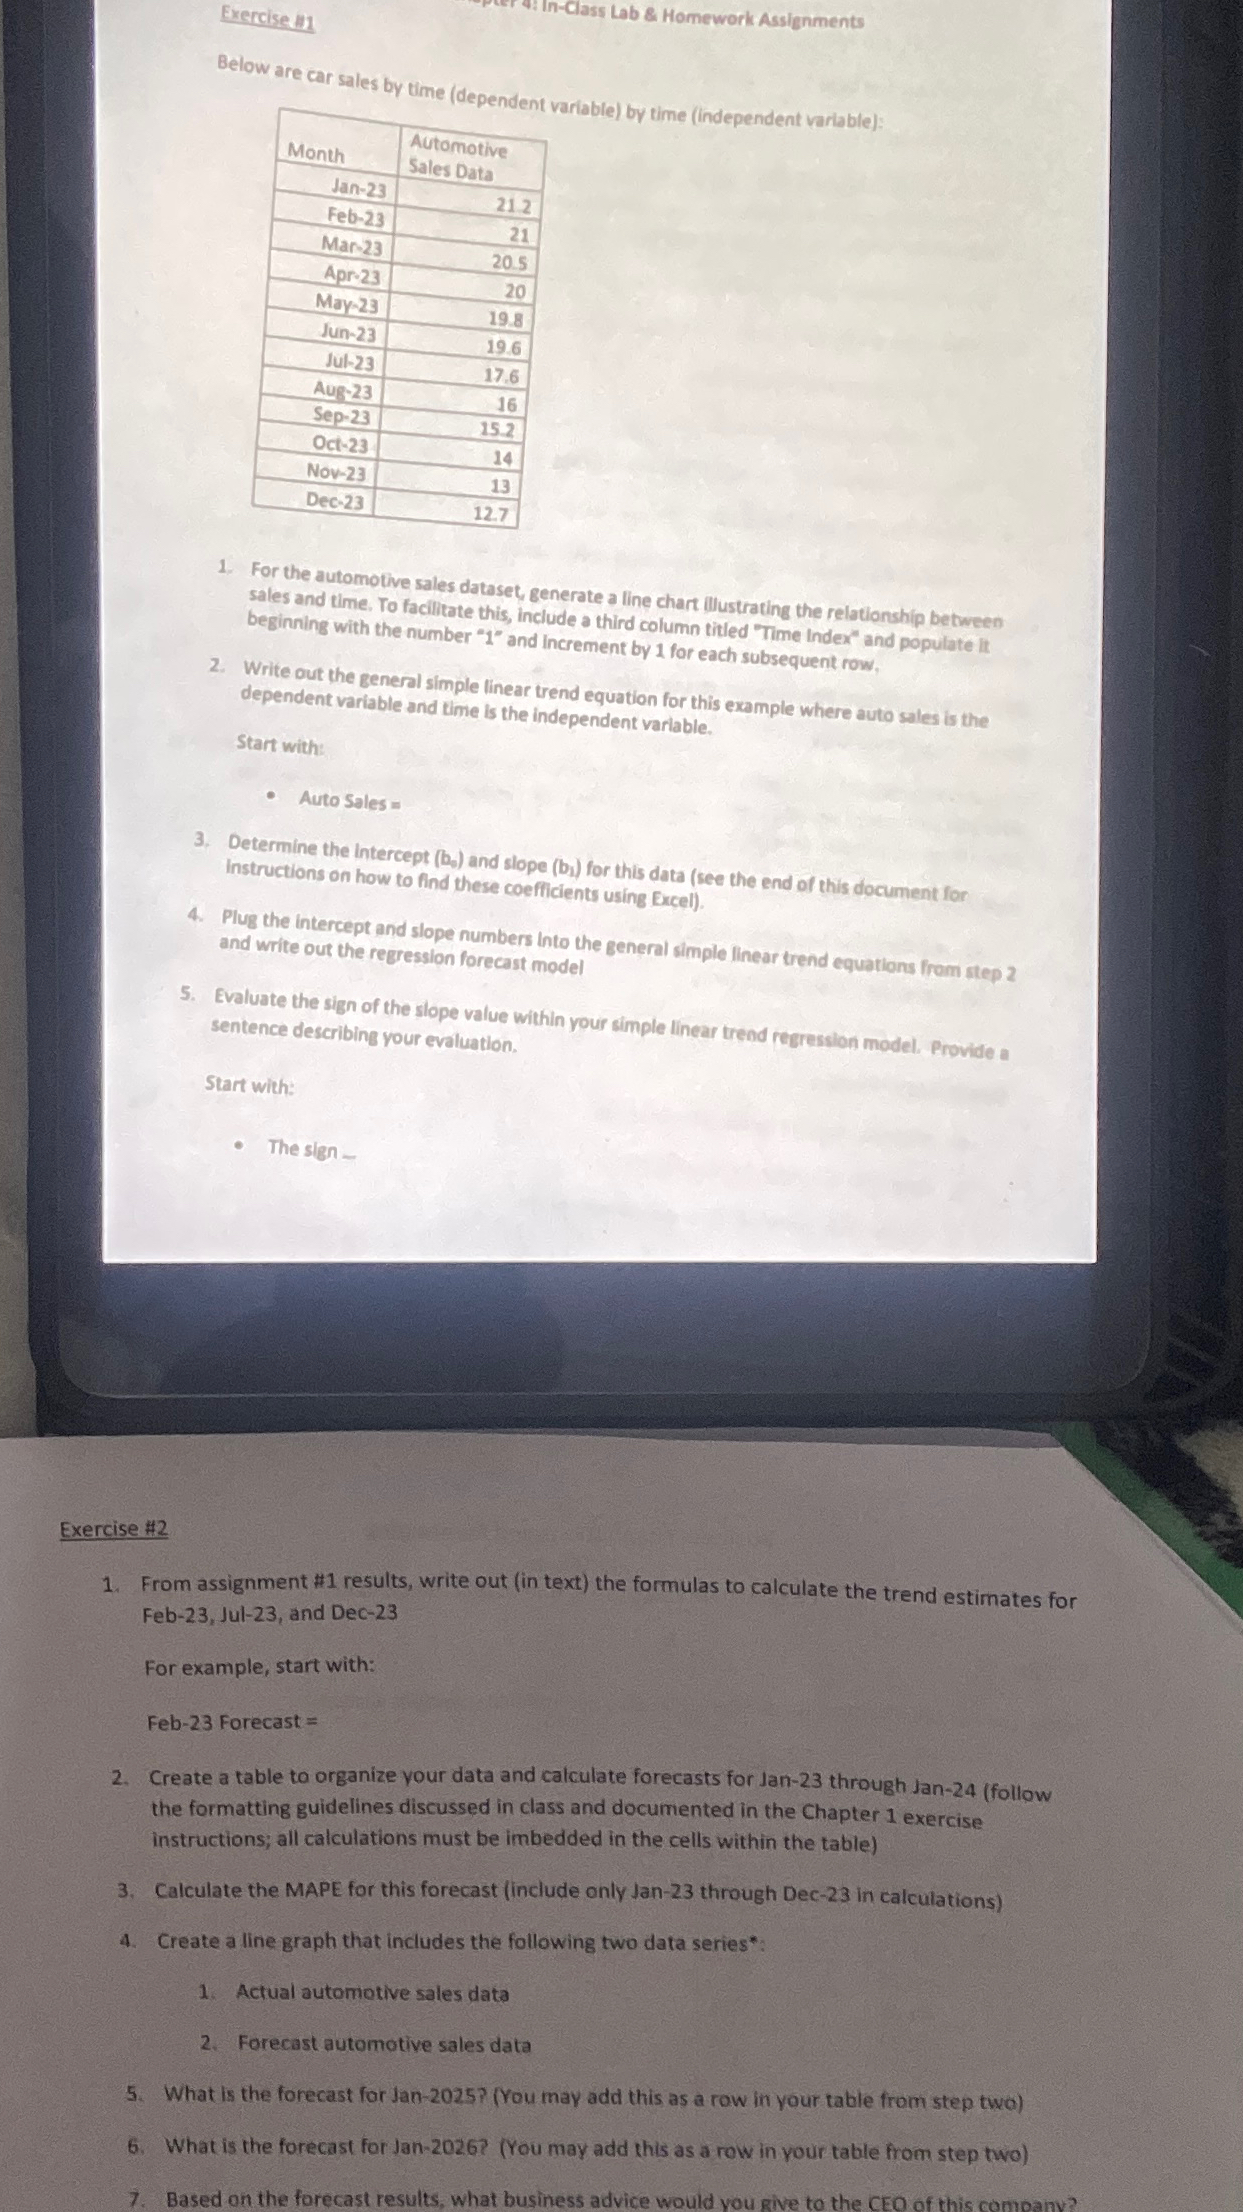
Below are car sales by time dependent varlable by time Independent varlable:
tableMonthtableAutomotiveSales DataJanFebMarAprMarJunJulAusSepOctNovDec
For the automotive sales dataset, generate a line chart Illustrating the relationship between sales and time, To facilitate this, include a third column titled "Time index" and populate it beginning with the number and increment by for each subsequent row,
Write out the general simple linear trend equation for this example where auto sales is the dependent variable and thine is the independent variable.
Start with:
Auto Sales
Determine the Intercept and slope for this data see the end of this document for Instructions on how to find these coefficients using Excel
Plug the intercept and slope numbers Into the general simple linear trend equations from step and write out the regression forecast model
Evaluate the sign of the slope value within your simple linear trend regression model. Provide a sentence describing your evaluation.
Start with:
The sign
Exercise #
From assignment # results, write out in text the formulas to calculate the trend estimates for Feb Jul and Dec
For example, start with:
Feb Forecast
Create a table to organize your data and calculate forecasts for Jan through Janfollow the formatting guidelines discussed in class and documented in the Chapter exercise instructions; all calculations must be imbedded in the cells within the table
Calculate the MAPE for this forecast include only Jan through Dec in calculations
Create a line graph that includes the following two data series:
Actual automotive sales data
Forecast automotive sales data
What is the forecast for JanYou may add this as a row in your table from step two
What is the forecast for JanYou may add this as a row in your table from step two
Step by Step Solution
There are 3 Steps involved in it
1 Expert Approved Answer
Step: 1 Unlock

Question Has Been Solved by an Expert!
Get step-by-step solutions from verified subject matter experts
Step: 2 Unlock
Step: 3 Unlock