

Question: Exercises/Problems 1. This activity applies to ROA and ROE models and ratio components. The Salza Technology Corporation success-fully increased its top line sales from $375,000
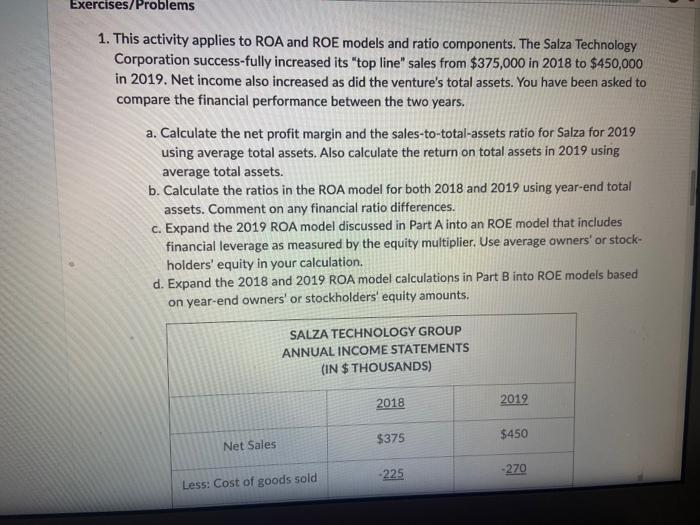
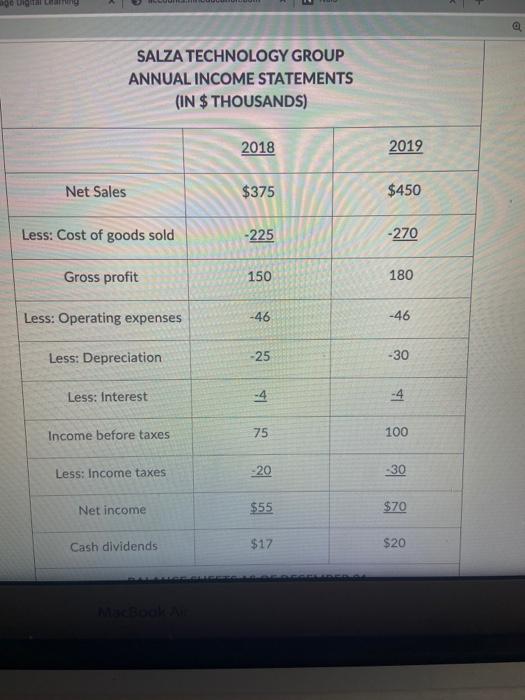

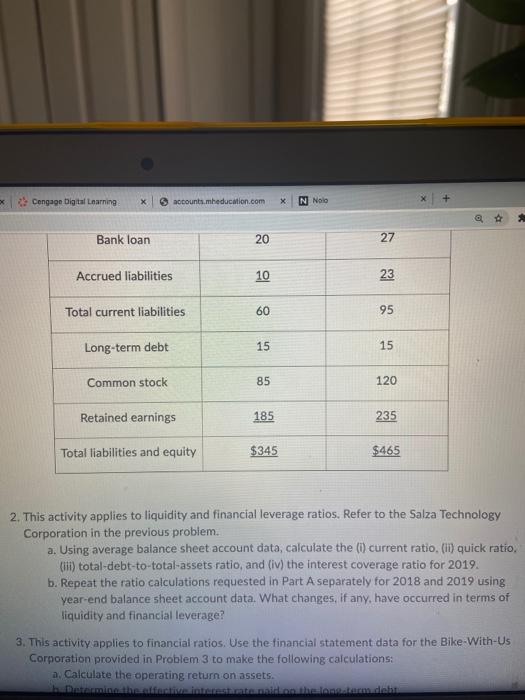
Exercises/Problems 1. This activity applies to ROA and ROE models and ratio components. The Salza Technology Corporation success-fully increased its "top line" sales from $375,000 in 2018 to $450,000 in 2019. Net income also increased as did the venture's total assets. You have been asked to compare the financial performance between the two years, a. Calculate the net profit margin and the sales-to-total-assets ratio for Salza for 2019 using average total assets. Also calculate the return on total assets in 2019 using average total assets. b. Calculate the ratios in the ROA model for both 2018 and 2019 using year-end total assets. Comment on any financial ratio differences. c. Expand the 2019 ROA model discussed in Part A into an ROE model that includes financial leverage as measured by the equity multiplier. Use average owners' or stock- holders' equity in your calculation. d. Expand the 2018 and 2019 ROA model calculations in Part B into ROE models based on year-end owners' or stockholders' equity amounts. SALZA TECHNOLOGY GROUP ANNUAL INCOME STATEMENTS (IN $ THOUSANDS) 2018 2019 $375 $450 Net Sales -225 -270 Less: Cost of goods sold 0 g SALZA TECHNOLOGY GROUP ANNUAL INCOME STATEMENTS (IN $ THOUSANDS) 2018 2019 Net Sales $375 $450 Less: Cost of goods sold -225 -270 Gross profit 150 180 Less: Operating expenses -46 -46 Less: Depreciation -25 -30 Less: Interest -4 Income before taxes 18 16 75 100 Less: Income taxes -30 Net income $55 $70 Cash dividends $17 $20 Boeken BALANCE SHEETS AS OF DECEMBER 31 (IN $ THOUSANDS) 2018 2019 Cash $39 $16 Accounts receivable 50 80 Inventories 151 204 Total current assets 240 300 Gross fixed assets 200 290 -95 -125 Less accumulated depreciation Net fixed assets 105 165 Total assets $345 $465 Accounts payable $30 $45 Bank loan 20 27 II FO Cengage Digital Learning > counts.mheducation.com N Nolo Bank loan 20 27 Accrued liabilities 10 23 Total current liabilities 60 95 15 15 Long-term debt Common stock 85 120 Retained earnings 185 235 Total liabilities and equity $345 $465 2. This activity applies to liquidity and financial leverage ratios. Refer to the Salza Technology Corporation in the previous problem. a. Using average balance sheet account data, calculate the (1) current ratio. (11) quick ratio, (ii) total-debt-to-total-assets ratio, and (iv) the interest coverage ratio for 2019. b. Repeat the ratio calculations requested in Part A separately for 2018 and 2019 using year-end balance sheet account data. What changes, if any, have occurred in terms of liquidity and financial leverage? 3. This activity applies financial ratios. Use the financial statement data for the Bike-With-Us Corporation provided in Problem 3 to make the following calculations: a. Calculate the operating return on assets. betamine the attention the long term de Exercises/Problems 1. This activity applies to ROA and ROE models and ratio components. The Salza Technology Corporation success-fully increased its "top line" sales from $375,000 in 2018 to $450,000 in 2019. Net income also increased as did the venture's total assets. You have been asked to compare the financial performance between the two years, a. Calculate the net profit margin and the sales-to-total-assets ratio for Salza for 2019 using average total assets. Also calculate the return on total assets in 2019 using average total assets. b. Calculate the ratios in the ROA model for both 2018 and 2019 using year-end total assets. Comment on any financial ratio differences. c. Expand the 2019 ROA model discussed in Part A into an ROE model that includes financial leverage as measured by the equity multiplier. Use average owners' or stock- holders' equity in your calculation. d. Expand the 2018 and 2019 ROA model calculations in Part B into ROE models based on year-end owners' or stockholders' equity amounts. SALZA TECHNOLOGY GROUP ANNUAL INCOME STATEMENTS (IN $ THOUSANDS) 2018 2019 $375 $450 Net Sales -225 -270 Less: Cost of goods sold 0 g SALZA TECHNOLOGY GROUP ANNUAL INCOME STATEMENTS (IN $ THOUSANDS) 2018 2019 Net Sales $375 $450 Less: Cost of goods sold -225 -270 Gross profit 150 180 Less: Operating expenses -46 -46 Less: Depreciation -25 -30 Less: Interest -4 Income before taxes 18 16 75 100 Less: Income taxes -30 Net income $55 $70 Cash dividends $17 $20 Boeken BALANCE SHEETS AS OF DECEMBER 31 (IN $ THOUSANDS) 2018 2019 Cash $39 $16 Accounts receivable 50 80 Inventories 151 204 Total current assets 240 300 Gross fixed assets 200 290 -95 -125 Less accumulated depreciation Net fixed assets 105 165 Total assets $345 $465 Accounts payable $30 $45 Bank loan 20 27 II FO Cengage Digital Learning > counts.mheducation.com N Nolo Bank loan 20 27 Accrued liabilities 10 23 Total current liabilities 60 95 15 15 Long-term debt Common stock 85 120 Retained earnings 185 235 Total liabilities and equity $345 $465 2. This activity applies to liquidity and financial leverage ratios. Refer to the Salza Technology Corporation in the previous problem. a. Using average balance sheet account data, calculate the (1) current ratio. (11) quick ratio, (ii) total-debt-to-total-assets ratio, and (iv) the interest coverage ratio for 2019. b. Repeat the ratio calculations requested in Part A separately for 2018 and 2019 using year-end balance sheet account data. What changes, if any, have occurred in terms of liquidity and financial leverage? 3. This activity applies financial ratios. Use the financial statement data for the Bike-With-Us Corporation provided in Problem 3 to make the following calculations: a. Calculate the operating return on assets. betamine the attention the long term de
Step by Step Solution
There are 3 Steps involved in it

Get step-by-step solutions from verified subject matter experts