

Question: Exhibit 1-1. A multiple linex C Exhibit 1-1. A Multiple Line X Finance question | Chegge X GThe value of the statistic x + edu/webapps/assessment/take/take.jsp?course_assessment_id=_269074_18_course_id
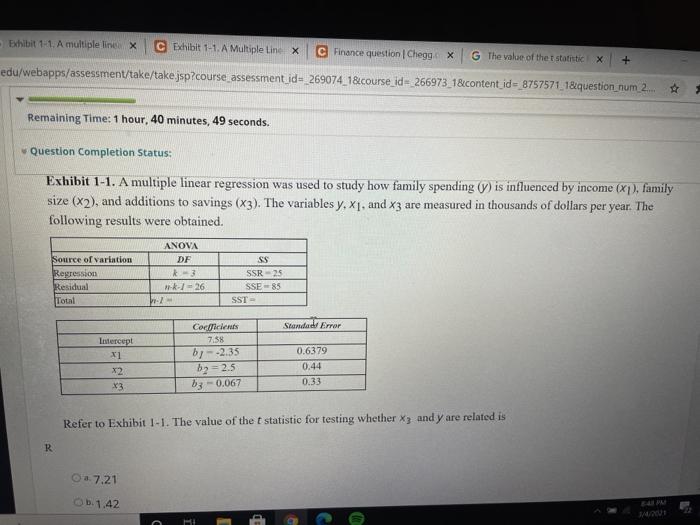
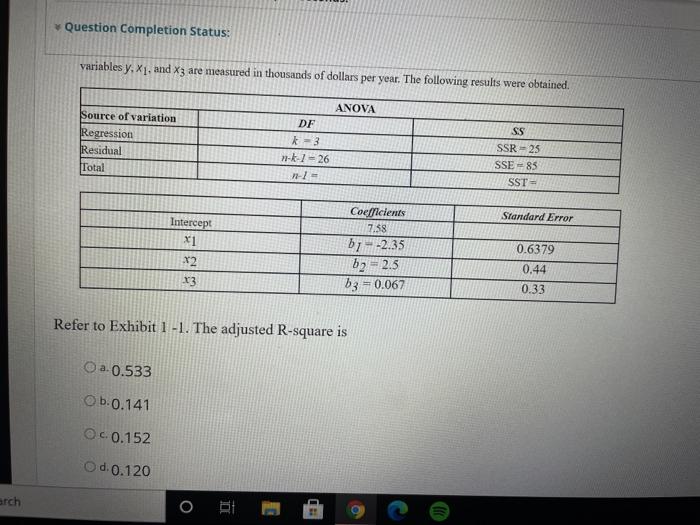
Exhibit 1-1. A multiple linex C Exhibit 1-1. A Multiple Line X Finance question | Chegge X GThe value of the statistic x + edu/webapps/assessment/take/take.jsp?course_assessment_id=_269074_18_course_id = 266973_18_content_id=_8757571_1&question_num_2 Remaining Time: 1 hour, 40 minutes, 49 seconds. Question Completion Status: Exhibit 1-1. A multiple linear regression was used to study how family spending (/) is influenced by income (X1), family size (X2), and additions to savings (x3). The variables y, X1, and x3 are measured in thousands of dollars per year. The following results were obtained. Source of variation Regression Residual Total ANOVA DF K-3 #k-1-26 --- SS SSR-25 SSE-85 SST Standad Error latercept X1 x2 x3 Corolles 7.58 b7--2.35 by 2.5 b3 -0.067 0,6379 0.44 0.33 Refer to Exhibit 1-1. The value of the statistic for testing whether Xy and y are related is R 8.7.21 b.1.42 Question Completion Status: variables y, X1, and X3 are measured in thousands of dollars per year. The following results were obtained Source of variation Regression Residual Total ANOVA DF k=3 -- = 26 12-1 SS SSR-25 SSE-85 SST - Standard Error Intercept x1 Coefficients 7.38 bi-2.35 b2 = 2.5 b3 = 0.067 X2 0.6379 0.44 x3 0.33 Refer to Exhibit 1 -1. The adjusted R-square is a. 0.533 Ob.0.141 OC. 0.152 O d. 0.120 arch O de Exhibit 1-1. A multiple linex C Exhibit 1-1. A Multiple Line X Finance question | Chegge X GThe value of the statistic x + edu/webapps/assessment/take/take.jsp?course_assessment_id=_269074_18_course_id = 266973_18_content_id=_8757571_1&question_num_2 Remaining Time: 1 hour, 40 minutes, 49 seconds. Question Completion Status: Exhibit 1-1. A multiple linear regression was used to study how family spending (/) is influenced by income (X1), family size (X2), and additions to savings (x3). The variables y, X1, and x3 are measured in thousands of dollars per year. The following results were obtained. Source of variation Regression Residual Total ANOVA DF K-3 #k-1-26 --- SS SSR-25 SSE-85 SST Standad Error latercept X1 x2 x3 Corolles 7.58 b7--2.35 by 2.5 b3 -0.067 0,6379 0.44 0.33 Refer to Exhibit 1-1. The value of the statistic for testing whether Xy and y are related is R 8.7.21 b.1.42 Question Completion Status: variables y, X1, and X3 are measured in thousands of dollars per year. The following results were obtained Source of variation Regression Residual Total ANOVA DF k=3 -- = 26 12-1 SS SSR-25 SSE-85 SST - Standard Error Intercept x1 Coefficients 7.38 bi-2.35 b2 = 2.5 b3 = 0.067 X2 0.6379 0.44 x3 0.33 Refer to Exhibit 1 -1. The adjusted R-square is a. 0.533 Ob.0.141 OC. 0.152 O d. 0.120 arch O de
Step by Step Solution
There are 3 Steps involved in it

Get step-by-step solutions from verified subject matter experts