

Question: Exhibit 1.10 (Panel A) is a heat map based on the profitability of the six districts for The AM Bakery. A new intern tells
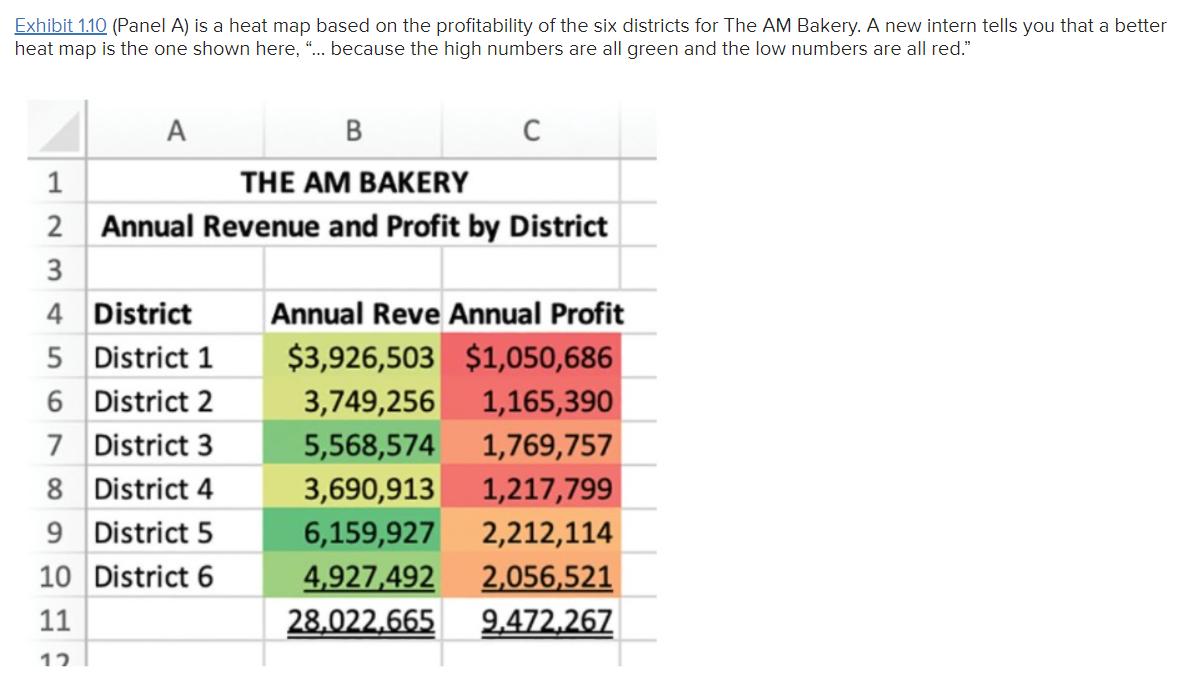

Exhibit 1.10 (Panel A) is a heat map based on the profitability of the six districts for The AM Bakery. A new intern tells you that a better heat map is the one shown here, "... because the high numbers are all green and the low numbers are all red." A B 1 THE AM BAKERY 2 Annual Revenue and Profit by District 3 4 District 5 District 1 6 District 2 7 District 3 8 District 4 9 District 5 10 District 6 11 12 C Annual Reve Annual Profit $3,926,503 $1,050,686 3,749,256 1,165,390 5,568,574 1,769,757 3,690,913 1,217,799 6,159,927 2,212,114 4,927,492 2,056,521 28,022,665 9.472,267 a. Can you identify the most profitable district from the intern's heat map? b. Do you think the intern's heat map is as effective at communicating the results of the analysis compared to the heat map in the Exhibit 1.10?
Step by Step Solution
3.50 Rating (150 Votes )
There are 3 Steps involved in it
SOLUTION a From the interns heat map it is not possible to identify the most profitable district acc... View full answer

Get step-by-step solutions from verified subject matter experts