

Question: Exhibit 1C AT&T Wireless Segment Data Wireless Operating Results ($ millions).* 2009 2010 2011 2012 2013 2014 Service Revenue 48,563 53,510 56,726 59,186 61,552
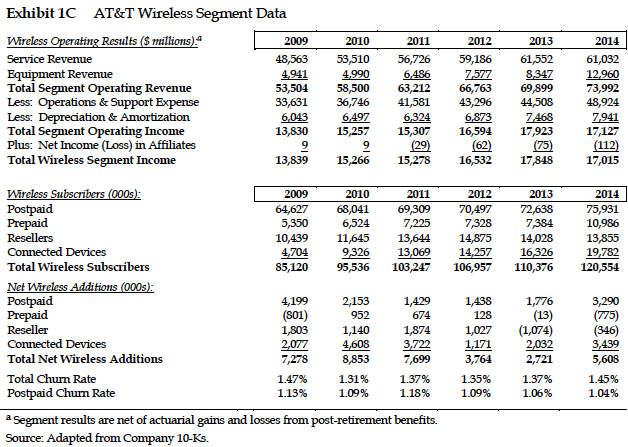
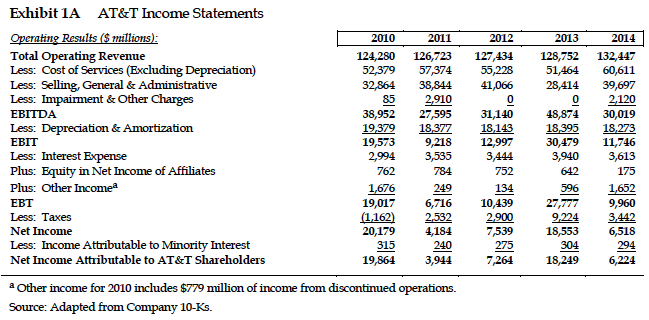
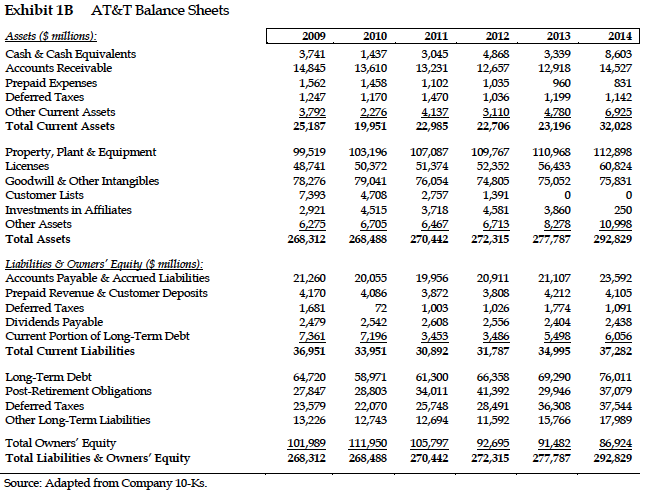
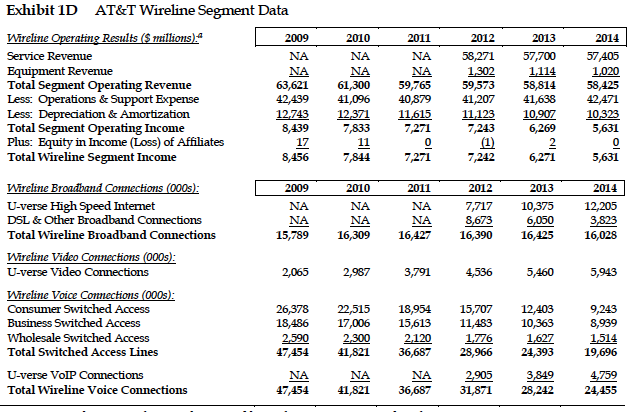
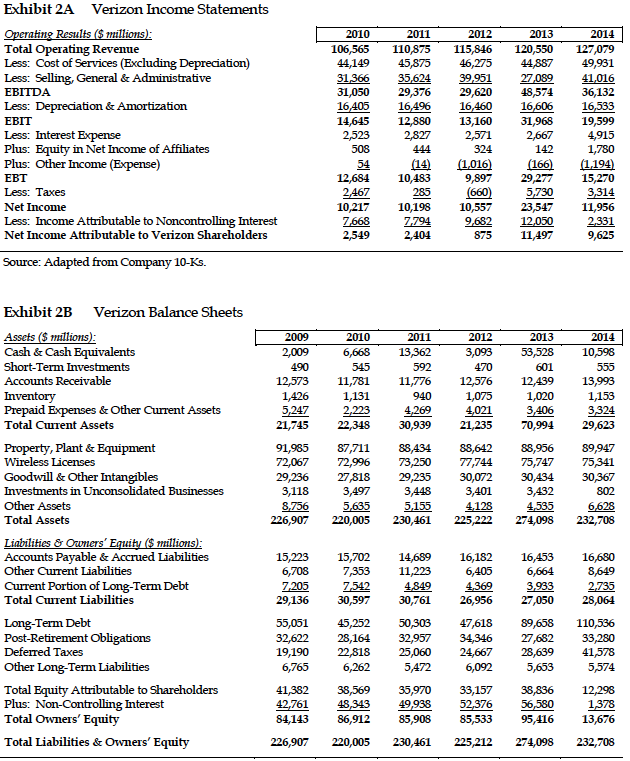
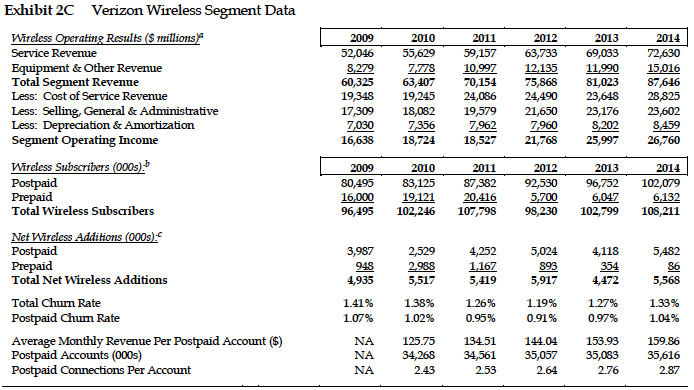
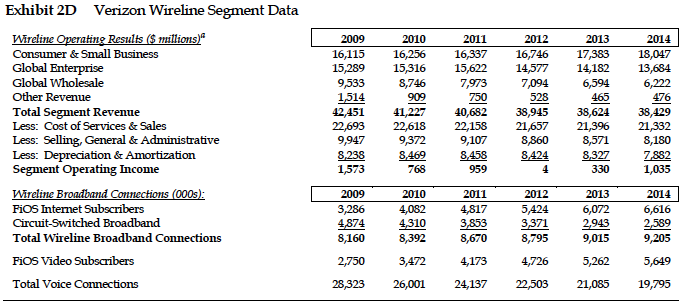
Exhibit 1C AT&T Wireless Segment Data Wireless Operating Results ($ millions).* 2009 2010 2011 2012 2013 2014 Service Revenue 48,563 53,510 56,726 59,186 61,552 61,032 Equipment Revenue 4,941 4,990 6,486 7,577 8,347 12,960 Total Segment Operating Revenue 53,504 58,500 63,212 66,763 69,899 73,992 Less: Operations & Support Expense 33,631 36,746 41,581 43,296 44,508 48,924 Less: Depreciation & Amortization 6,043 6,497 6,324 6,873 7,468 7,941 Total Segment Operating Income 13,830 15,257 15,307 16,594 17,923 17,127 Plus: Net Income (Loss) in Affiliates Total Wireless Segment Income 9 9 (29) (62) (75) (112) 13,839 15,266 15,278 16,532 17,848 17,015 Wireless Subscribers (000s): Postpaid 2009 2010 2011 2012 2013 2014 64,627 68,041 69,309 70,497 72,638 75,931 Prepaid 5,350 6,524 7,225 7,328 7,384 10,986 Resellers 10,439 11,645 13,644 14,875 14,028 13,855 Connected Devices 4,704 9,326 13,069 14,257 16,326 19,782 Total Wireless Subscribers 85,120 95,536 103,247 106,957 110,376 120,554 Net Wireless Additions (000s): Postpaid 4,199 2,153 1,429 1,438 1,776 3,290 Prepaid (801) 952 674 128 (13) (775) Reseller 1,803 1,140 1,874 1,027 (1,074) (346) Connected Devices 2,077 4,608 3,722 1,171 2,032 3,439 Total Net Wireless Additions 7,278 8,853 7,699 3,764 2,721 5,608 Total Churn Rate 1.47% 1.31% 1.37% 1.35% 1.37% 1.45% Postpaid Churn Rate 1.13% 1.09% 1.18% 1.09% 1.06% 1.04% a Segment results are net of actuarial gains and losses from post-retirement benefits. Source: Adapted from Company 10-Ks. Exhibit 1A AT&T Income Statements Operating Results ($ millions): 2010 2011 2012 Total Operating Revenue 124,280 126,723 127,434 2013 128,752 2014 132,447 Less: Cost of Services (Excluding Depreciation) 52,379 57,374 55,228 51,464 60,611 Less: Selling, General & Administrative 32,864 38,844 41,066 28,414 39,697 Less: Impairment & Other Charges 85 2,910 0 0 2,120 EBITDA 38,952 27,595 31,140 48,874 30,019 Less: Depreciation & Amortization 19,379 18,377 18,143 18,395 18,273 EBIT 19,573 9,218 12,997 30,479 11,746 Less: Interest Expense 2,994 3,535 3,444 3,940 3,613 Plus: Equity in Net Income of Affiliates 762 784 752 642 175 Plus: Other Income 1,676 249 134 596 1,652 EBT 19,017 6,716 10,439 27,777 9,960 Less: Taxes (1,162) 2,532 2,900 9,224 3,442 Net Income 20,179 4,184 7,539 18,553 6,518 Less: Income Attributable to Minority Interest 315 240 275 304 294 Net Income Attributable to AT&T Shareholders 19,864 3,944 7,264 18,249 6,224 a Other income for 2010 includes $779 million of income from discontinued operations. Source: Adapted from Company 10-Ks. Exhibit 1B AT&T Balance Sheets Assets ($ millions): 2009 2010 2011 2012 2013 2014 Cash & Cash Equivalents 3,741 1,437 3,045 4,868 3,339 8,603 Accounts Receivable 14,845 13,610 13,231 12,657 12,918 14,527 Prepaid Expenses 1,562 1,458 1,102 1,035 960 831 Deferred Taxes 1,247 1,170 1,470 1,036 1,199 1,142 Other Current Assets 3,792 2,276 4,137 3,110 4,780 6,925 Total Current Assets 25,187 19,951 22,985 22,706 23,196 32,028 Property, Plant & Equipment 99,519 103,196 107,087 109,767 110,968 112,898 Licenses 48,741 50,372 51,374 52,352 56,433 60,824 Goodwill & Other Intangibles 78,276 79,041 76,054 74,805 75,052 75,831 Customer Lists 7,393 4,708 2,757 1,391 0 0 Investments in Affiliates 2,921 4,515 3,718 4,581 3,860 250 Other Assets 6,275 6,705 6,467 6,713 8,278 10,998 Total Assets 268,312 268,488 270,442 272,315 277,787 292,829 Liabilities & Owners' Equity ($ millions): Accounts Payable & Accrued Liabilities 21,260 20,055 19,956 20,911 21,107 23,592 Prepaid Revenue & Customer Deposits 4,170 4,086 3,872 3,808 4,212 4,105 Deferred Taxes 1,681 72 1,003 1,026 1,774 1,091 Dividends Payable 2,479 2,542 2,608 2,556 2,404 2,438 Current Portion of Long-Term Debt 7,361 7,196 3,453 3,486 5,498 6,056 Total Current Liabilities 36,951 33,951 30,892 31,787 34,995 37,282 Long-Term Debt 64,720 58,971 61,300 66,358 69,290 76,011 Post-Retirement Obligations 27,847 28,803 34,011 41,392 29,946 37,079 Deferred Taxes 23,579 22,070 25,748 28,491 36,308 37,544 Other Long-Term Liabilities 13,226 12,743 12,694 11,592 15,766 17,989 Total Owners' Equity Total Liabilities & Owners' Equity 101,989 111,950 105,797 268,312 268,488 270,442 92,695 91,482 86,924 272,315 277,787 292,829 Source: Adapted from Company 10-Ks. Exhibit 1D AT&T Wireline Segment Data Wireline Operating Results ($ millions)." 2009 2010 2011 2012 2013 2014 Service Revenue NA NA 58,271 57,700 57,405 Equipment Revenue NA 1,302 1,114 1,020 Total Segment Operating Revenue 63,621 61,300 59,765 59,573 58,814 58,425 Less: Operations & Support Expense 42,439 41,096 40,879 41,207 41,638 42,471 Less: Depreciation & Amortization 12,743 12,371 11,615 11,123 10,907 10,323 Total Segment Operating Income 8,439 7,833 7,271 7,243 6,269 5,631 Plus: Equity in Income (Loss) of Affiliates 17 11 0 (1) 2 0 Total Wireline Segment Income 8,456 7,844 7,271 7,242 6,271 5,631 Wireline Broadband Connections (000s): 2009 2010 2011 2012 2013 2014 U-verse High Speed Internet 7,717 10,375 12,205 DSL & Other Broadband Connections NA NA 8,673 6,050 3,823 Total Wireline Broadband Connections 15,789 16,309 16,427 16,390 16,425 16,028 Wireline Video Connections (000s): U-verse Video Connections 2,065 2,987 3,791 4,536 5,460 5,943 Wireline Voice Connections (000s): Consumer Switched Access 26,378 22,515 18,954 15,707 12,403 9,243 Business Switched Access 18,486 17,006 15,613 11,483 10,363 8,939 Wholesale Switched Access 2,590 2,300 2,120 1,776 1,627 1,514 Total Switched Access Lines 47,454 41,821 36,687 28,966 24,393 19,696 U-verse VoIP Connections NA NA 2,905 3,849 4,759 Total Wireline Voice Connections 47,454 41,821 36,687 31,871 28,242 24,455 Exhibit 2A Verizon Income Statements Operating Results ($ millions): 2010 2011 2012 2013 2014 Total Operating Revenue 106,565 110,875 115,846 120,550 127,079 Less: Cost of Services (Excluding Depreciation) 44,149 45,875 46,275 44,887 49,931 Less: Selling, General & Administrative 31,366 35,624 39,951 27,089 41,016 EBITDA 31,050 29,376 29,620 48,574 36,132 Less: Depreciation & Amortization 16,405 16,496 16,460 16,606 16,533 EBIT 14,645 12,880 13,160 31,968 19,599 Less: Interest Expense 2,523 2,827 2,571 2,667 4,915 Plus: Equity in Net Income of Affiliates 508 444 324 142 1,780 Plus: Other Income (Expense) 54 (14) (1,016) (166) (1,194) EBT 12,684 10,483 9,897 29,277 15,270 Less: Taxes 2,467 285 (660) 5,730 3,314 Net Income 10,217 10,198 10,557 23,547 11,956 Less: Income Attributable to Noncontrolling Interest 7,668 7,794 9,682 12,050 2,331 Net Income Attributable to Verizon Shareholders 2,549 2,404 875 11,497 9,625 Source: Adapted from Company 10-Ks. Exhibit 2B Verizon Balance Sheets Assets ($ millions): 2009 2010 2011 2012 Cash & Cash Equivalents 2,009 6,668 13,362 3,093 2013 53,528 2014 10,598 Short-Term Investments 490 545 592 470 601 555 Accounts Receivable 12,573 11,781 11,776 12,576 12,439 13,993 Inventory 1,426 1,131 940 1,075 1,020 1,153 Prepaid Expenses & Other Current Assets 5,247 2,223 4,269 4,021 3,406 3,324 Total Current Assets 21,745 22,348 30,939 21,235 70,994 29,623 Property, Plant & Equipment 91,985 87,711 88,434 88,642 88,956 89,947 Wireless Licenses 72,067 72,996 73,250 77,744 75,747 75,341 Goodwill & Other Intangibles 29,236 27,818 29,235 30,072 30,434 30,367 Investments in Unconsolidated Businesses 3,118 3,497 3,448 3,401 3,432 802 Other Assets 8,756 5,635 5,155 4,128 4,535 6,628 Total Assets 226,907 220,005 230,461 225,222 274,098 232,708 Liabilities & Owners' Equity ($ millions): Accounts Payable & Accrued Liabilities 15,223 15,702 14,689 16,182 16,453 16,680 Other Current Liabilities 6,708 7,353 11,223 6,405 6,664 8,649 Current Portion of Long-Term Debt 7,205 7,542 4,849 4,369 3,933 2,735 Total Current Liabilities 29,136 30,597 30,761 26,956 27,050 28,064 Long-Term Debt 55,051 45,252 50,303 47,618 89,658 110,536 Post-Retirement Obligations 32,622 28,164 32,957 34,346 27,682 33,280 Deferred Taxes 19,190 22,818 25,060 24,667 28,639 41,578 Other Long-Term Liabilities 6,765 6,262 5,472 6,092 5,653 5,574 Total Equity Attributable to Shareholders 41,382 38,569 35,970 33,157 38,836 12,298 Plus: Non-Controlling Interest 42,761 48,343 49,938 52,376 56,580 1,378 Total Owners' Equity 84,143 86,912 85,908 85,533 95,416 13,676 Total Liabilities & Owners' Equity 226,907 220,005 230,461 225,212 274,098 232,708 Exhibit 2C Verizon Wireless Segment Data Wireless Operating Results ($ millions)* 2009 2010 2011 2012 2013 2014 Service Revenue 52,046 55,629 59,157 63,733 69,033 72,630 Equipment & Other Revenue 8,279 7,778 10,997 12,135 11,990 15,016 Total Segment Revenue 60,325 63,407 70,154 75,868 81,023 87,646 Less: Cost of Service Revenue 19,348 19,245 24,086 24,490 23,648 28,825 Less: Selling, General & Administrative 17,309 18,082 19,579 21,650 23,176 23,602 Less: Depreciation & Amortization 7,030 7,356 7,962 7,960 8,202 8,459 Segment Operating Income 16,638 18,724 18,527 21,768 25,997 26,760 Wireless Subscribers (000s). 2009 2010 2011 2012 2013 2014 Postpaid 80,495 83,125 87,382 92,530 96,752 102,079 Prepaid 16,000 19,121 20,416 5,700 6,047 Total Wireless Subscribers 96,495 102,246 107,798 98,230 102,799 6,132 108,211 Net Wireless Additions (000s). Postpaid 3,987 2,529 4,252 5,024 4,118 5,482 Prepaid 948 2,988 1,167 893 354 86 Total Net Wireless Additions 4,935 5,517 5,419 5,917 4,472 5,568 Total Churn Rate 1.41% 1.38% 1.26% 1.19% 1.27% 1.33% Postpaid Chum Rate 1.07% 1.02% 0.95% 0.91% 0.97% 1.04% Average Monthly Revenue Per Postpaid Account ($) NA 125.75 134.51 144.04 153.93 159.86 Postpaid Accounts (000s) 34,268 34,561 35,057 35,083 35,616 Postpaid Connections Per Account NA 2.43 2.53 2.64 2.76 2.87 Exhibit 2D Verizon Wireline Segment Data Wireline Operating Results ($ millions)" Consumer & Small Business Global Enterprise 2009 2010 2011 2012 2013 2014 16,115 16,256 16,337 16,746 17,383 18,047 15,289 15,316 15,622 14,577 14,182 13,684 Global Wholesale Other Revenue 9,533 8,746 7,973 7,094 6,594 6,222 1,514 909 750 528 465 476 Total Segment Revenue 42,451 41,227 40,682 38,945 38,624 38,429 Less: Cost of Services & Sales 22,693 22,618 22,158 21,657 21,396 21,332 Less: Selling, General & Administrative 9,947 9,372 9,107 8,860 8,571 8,180 Less: Depreciation & Amortization 8,238 8,469 8,458 8,424 8,327 7,882 Segment Operating Income 1,573 768 959 4 330 1,035 Wireline Broadband Connections (000s): 2009 2010 2011 2012 2013 2014 FiOS Internet Subscribers 3,286 4,082 4,817 5,424 6,072 6,616 Circuit-Switched Broadband 4,874 4,310 3,853 3,371 2,943 2,589 Total Wireline Broadband Connections 8,160 8,392 8,670 8,795 9,015 9,205 FiOS Video Subscribers 2,750 3,472 4,173 4,726 5,262 5,649 Total Voice Connections 28,323 26,001 24,137 22,503 21,085 19,795
Step by Step Solution
There are 3 Steps involved in it

Get step-by-step solutions from verified subject matter experts