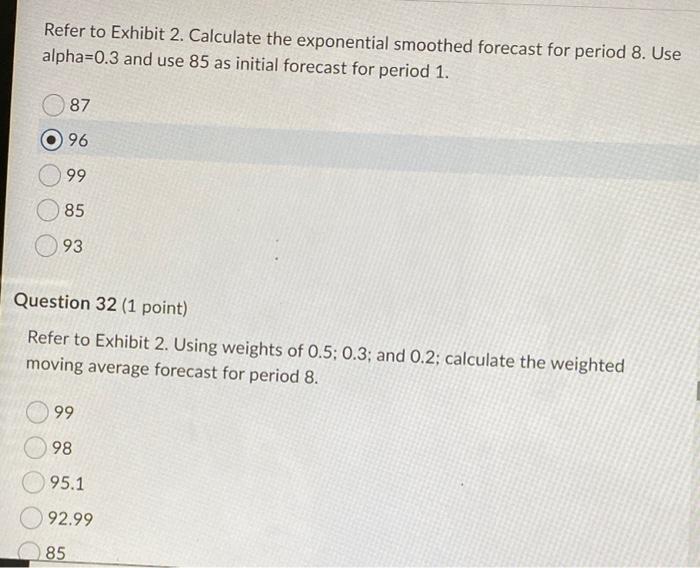
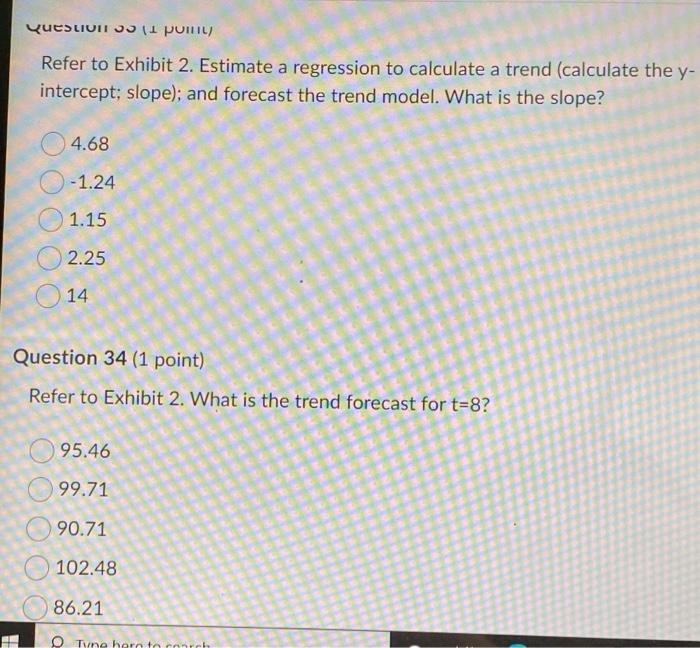
Question: Exhibit 2. Consider the following historical demand data: (Double check: Total demand for 7 periods is 635) Period 1 2 3 5 Demand 6 85

Exhibit 2. Consider the following historical
Exhibit 2. Consider the following historical demand data: (Double check: Total demand for 7 periods is 635) Period 1 2 3 5 Demand 6 85 7 83 89 99 84 99 96 Refer to Exhibit 2. Calculate the exponential smoothed forecast for period 8. Use alpha=0.3 and use 85 as initial forecast for period 1. 87 96 99 85 93 Question 32 (1 point) Refer to Exhibit 2. Using weights of 0.5; 0.3; and 0.2; calculate the weighted moving average forecast for period 8. 99 98 95.1 92.99 85 Question 11 pollic) Refer to Exhibit 2. Estimate a regression to calculate a trend (calculate the y- intercept; slope); and forecast the trend model. What is the slope? 4.68 - 1.24 1.15 2.25 14 Question 34 (1 point) Refer to Exhibit 2. What is the trend forecast for t=8? 95.46 99.71 90.71 102.48 86.21 Tvne her to conch

Step by Step Solution

There are 3 Steps involved in it

1 Expert Approved Answer
Step: 1 Unlock blur-text-image
Question Has Been Solved by an Expert!

Get step-by-step solutions from verified subject matter experts

Step: 2 Unlock
Step: 3 Unlock

Students Have Also Explored These Related General Management Questions!