

Question: Exhibit 3 Below you are given a regression output based on a sample of 25 observations. Coefficient Standard Error Constant 48.682 145.321 25.625 X, X2
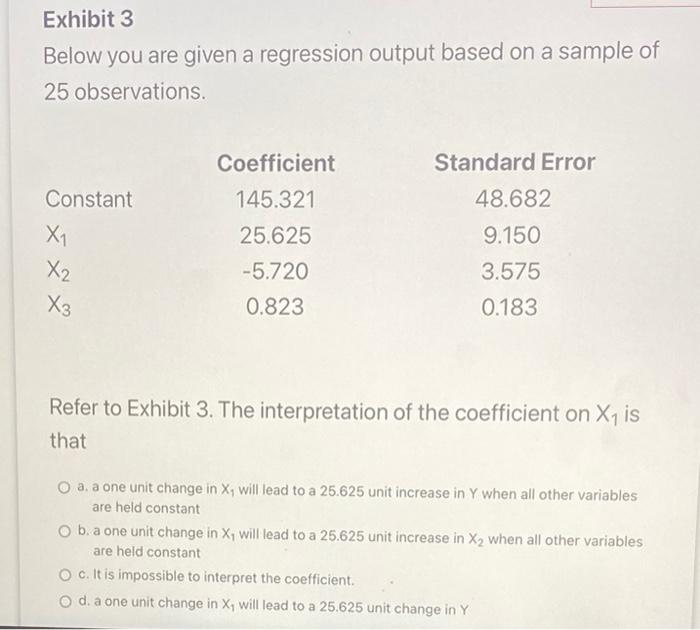
Exhibit 3 Below you are given a regression output based on a sample of 25 observations. Coefficient Standard Error Constant 48.682 145.321 25.625 X, X2 9.150 3.575 0.183 -5.720 0.823 X3 Refer to Exhibit 3. The interpretation of the coefficient on X1 is that O a, a one unit change in X, will lead to a 25.625 unit increase in Y when all other variables are held constant O b. a one unit change in X, will lead to a 25.625 unit increase in X2 when all other variables are held constant O c. It is impossible to interpret the coefficient. O d. a one unit change in X, will lead to a 25.625 unit change in Y
Step by Step Solution
There are 3 Steps involved in it
1 Expert Approved Answer
Step: 1 Unlock

Question Has Been Solved by an Expert!
Get step-by-step solutions from verified subject matter experts
Step: 2 Unlock
Step: 3 Unlock