

Question: (Exhibit 5) What does Exhibit 5 represent? a side-by-side bar chart based on a pivot table a relative frequency tabular statistic the relationship between median
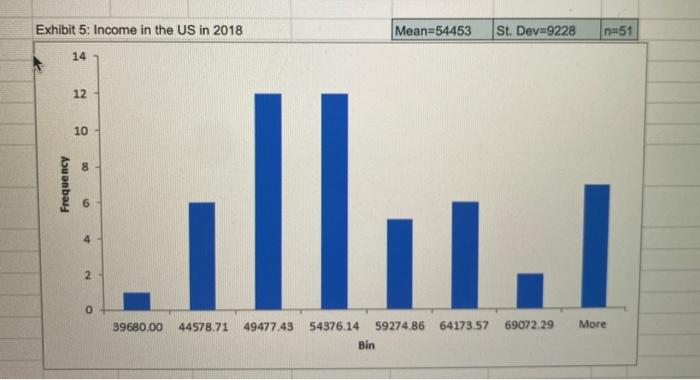
(Exhibit 5) What does Exhibit 5 represent? a side-by-side bar chart based on a pivot table a relative frequency tabular statistic the relationship between median income and age a histogram of income in the US Exhibit 5: Income in the US in 2018 Mean=54453 St. Dev=9228 n=51 14 12 10 00 Frequency 6 2 0 39680.00 44578.71 49477.43 64173.57 69072.29 More 54376.14 59274.86 Bin
Step by Step Solution
There are 3 Steps involved in it
1 Expert Approved Answer
Step: 1 Unlock

Question Has Been Solved by an Expert!
Get step-by-step solutions from verified subject matter experts
Step: 2 Unlock
Step: 3 Unlock