

Question: Exit Fullscreen Part A: Horizontal Analysis 2015 2014 2013 Item $880 000 Net Sales $800 000 $650 000 $ 640 000 480 000 Cost of
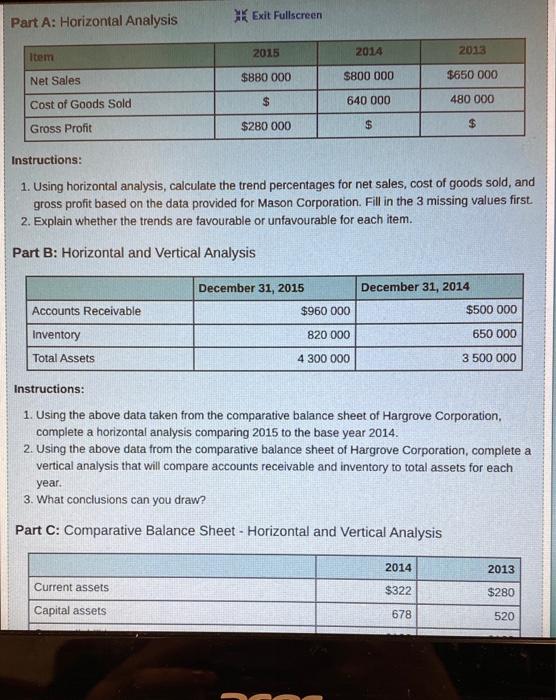
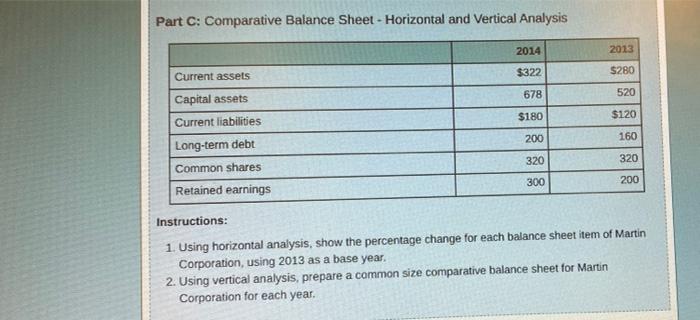
Exit Fullscreen Part A: Horizontal Analysis 2015 2014 2013 Item $880 000 Net Sales $800 000 $650 000 $ 640 000 480 000 Cost of Goods Sold $280 000 Gross Profit $ $ Instructions: 1. Using horizontal analysis, calculate the trend percentages for net sales, cost of goods sold, and gross profit based on the data provided for Mason Corporation. Fill in the 3 missing values first. 2. Explain whether the trends are favourable or unfavourable for each item. Part B: Horizontal and Vertical Analysis December 31, 2015 December 31, 2014 Accounts Receivable $960 000 $500 000 Inventory 820 000 650 000 Total Assets 4 300 000 3 500 000 Instructions: 1. Using the above data taken from the comparative balance sheet of Hargrove Corporation, complete a horizontal analysis comparing 2015 to the base year 2014. 2. Using the above data from the comparative balance sheet of Hargrove Corporation, complete a vertical analysis that will compare accounts receivable and inventory to total assets for each year. 3. What conclusions can you draw? Part C: Comparative Balance Sheet - Horizontal and Vertical Analysis 2014 2013 Current assets $322 $280 Capital assets. 678 520 Part C: Comparative Balance Sheet - Horizontal and Vertical Analysis 2014 2013 Current assets $322 $280 Capital assets 678 520 Current liabilities $180 $120 Long-term debt 200 160 320 320 Common shares 300 200 Retained earnings Instructions: 1. Using horizontal analysis, show the percentage change for each balance sheet item of Martin Corporation, using 2013 as a base year. 2. Using vertical analysis, prepare a common size comparative balance sheet for Martin Corporation for each year
Step by Step Solution
There are 3 Steps involved in it

Get step-by-step solutions from verified subject matter experts