

Question: expected return 13.90% SD 15.41% 3. You recently received $1,000,000 because you were the 1,000,000th person to purchase a 20-ounce Sprite Zero. You want to
expected return 13.90%
SD 15.41%
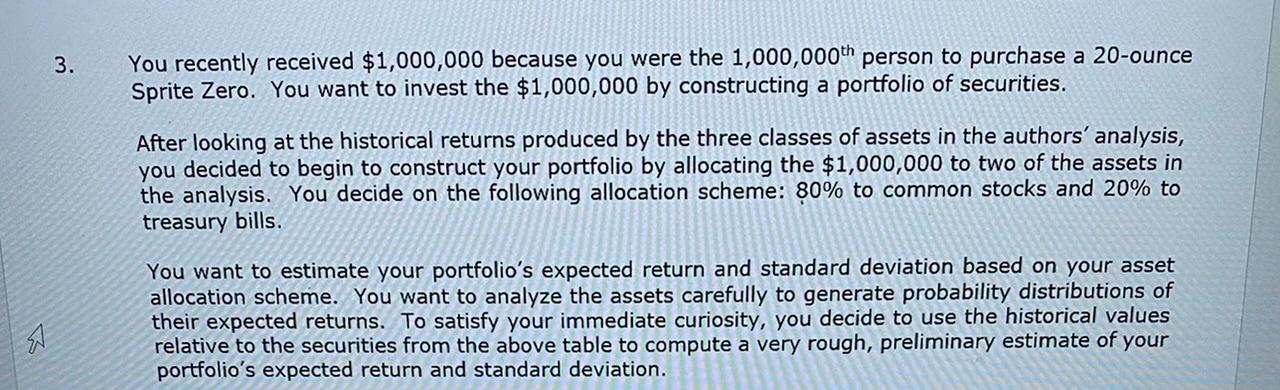
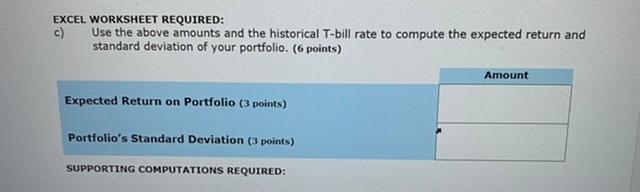
3. You recently received $1,000,000 because you were the 1,000,000th person to purchase a 20-ounce Sprite Zero. You want to invest the $1,000,000 by constructing a portfolio of securities. After looking at the historical returns produced by the three classes of assets in the authors' analysis, you decided to begin to construct your portfolio by allocating the $1,000,000 to two of the assets in the analysis. You decide on the following allocation scheme: 80% to common stocks and 20% to treasury bills. You want to estimate your portfolio's expected return and standard deviation based on your asset allocation scheme. You want to analyze the assets carefully to generate probability distributions of their expected returns. To satisfy your immediate curiosity, you decide to use the historical values relative to the securities from the above table to compute a very rough, preliminary estimate of your portfolio's expected return and standard deviation. A EXCEL WORKSHEET REQUIRED: c) Use the above amounts and the historical T-bill rate to compute the expected return and standard deviation of your portfolio. (6 points) Amount Expected Return on Portfolio (3 points) Portfolio's Standard Deviation (3 points) SUPPORTING COMPUTATIONS REQUIRED: 3. You recently received $1,000,000 because you were the 1,000,000th person to purchase a 20-ounce Sprite Zero. You want to invest the $1,000,000 by constructing a portfolio of securities. After looking at the historical returns produced by the three classes of assets in the authors' analysis, you decided to begin to construct your portfolio by allocating the $1,000,000 to two of the assets in the analysis. You decide on the following allocation scheme: 80% to common stocks and 20% to treasury bills. You want to estimate your portfolio's expected return and standard deviation based on your asset allocation scheme. You want to analyze the assets carefully to generate probability distributions of their expected returns. To satisfy your immediate curiosity, you decide to use the historical values relative to the securities from the above table to compute a very rough, preliminary estimate of your portfolio's expected return and standard deviation. A EXCEL WORKSHEET REQUIRED: c) Use the above amounts and the historical T-bill rate to compute the expected return and standard deviation of your portfolio. (6 points) Amount Expected Return on Portfolio (3 points) Portfolio's Standard Deviation (3 points) SUPPORTING COMPUTATIONS REQUIRED
Step by Step Solution
There are 3 Steps involved in it

Get step-by-step solutions from verified subject matter experts