

Question: Expected return and standard deviation for stocks A and B are shown in the table below. Rate of return if Probability State of state
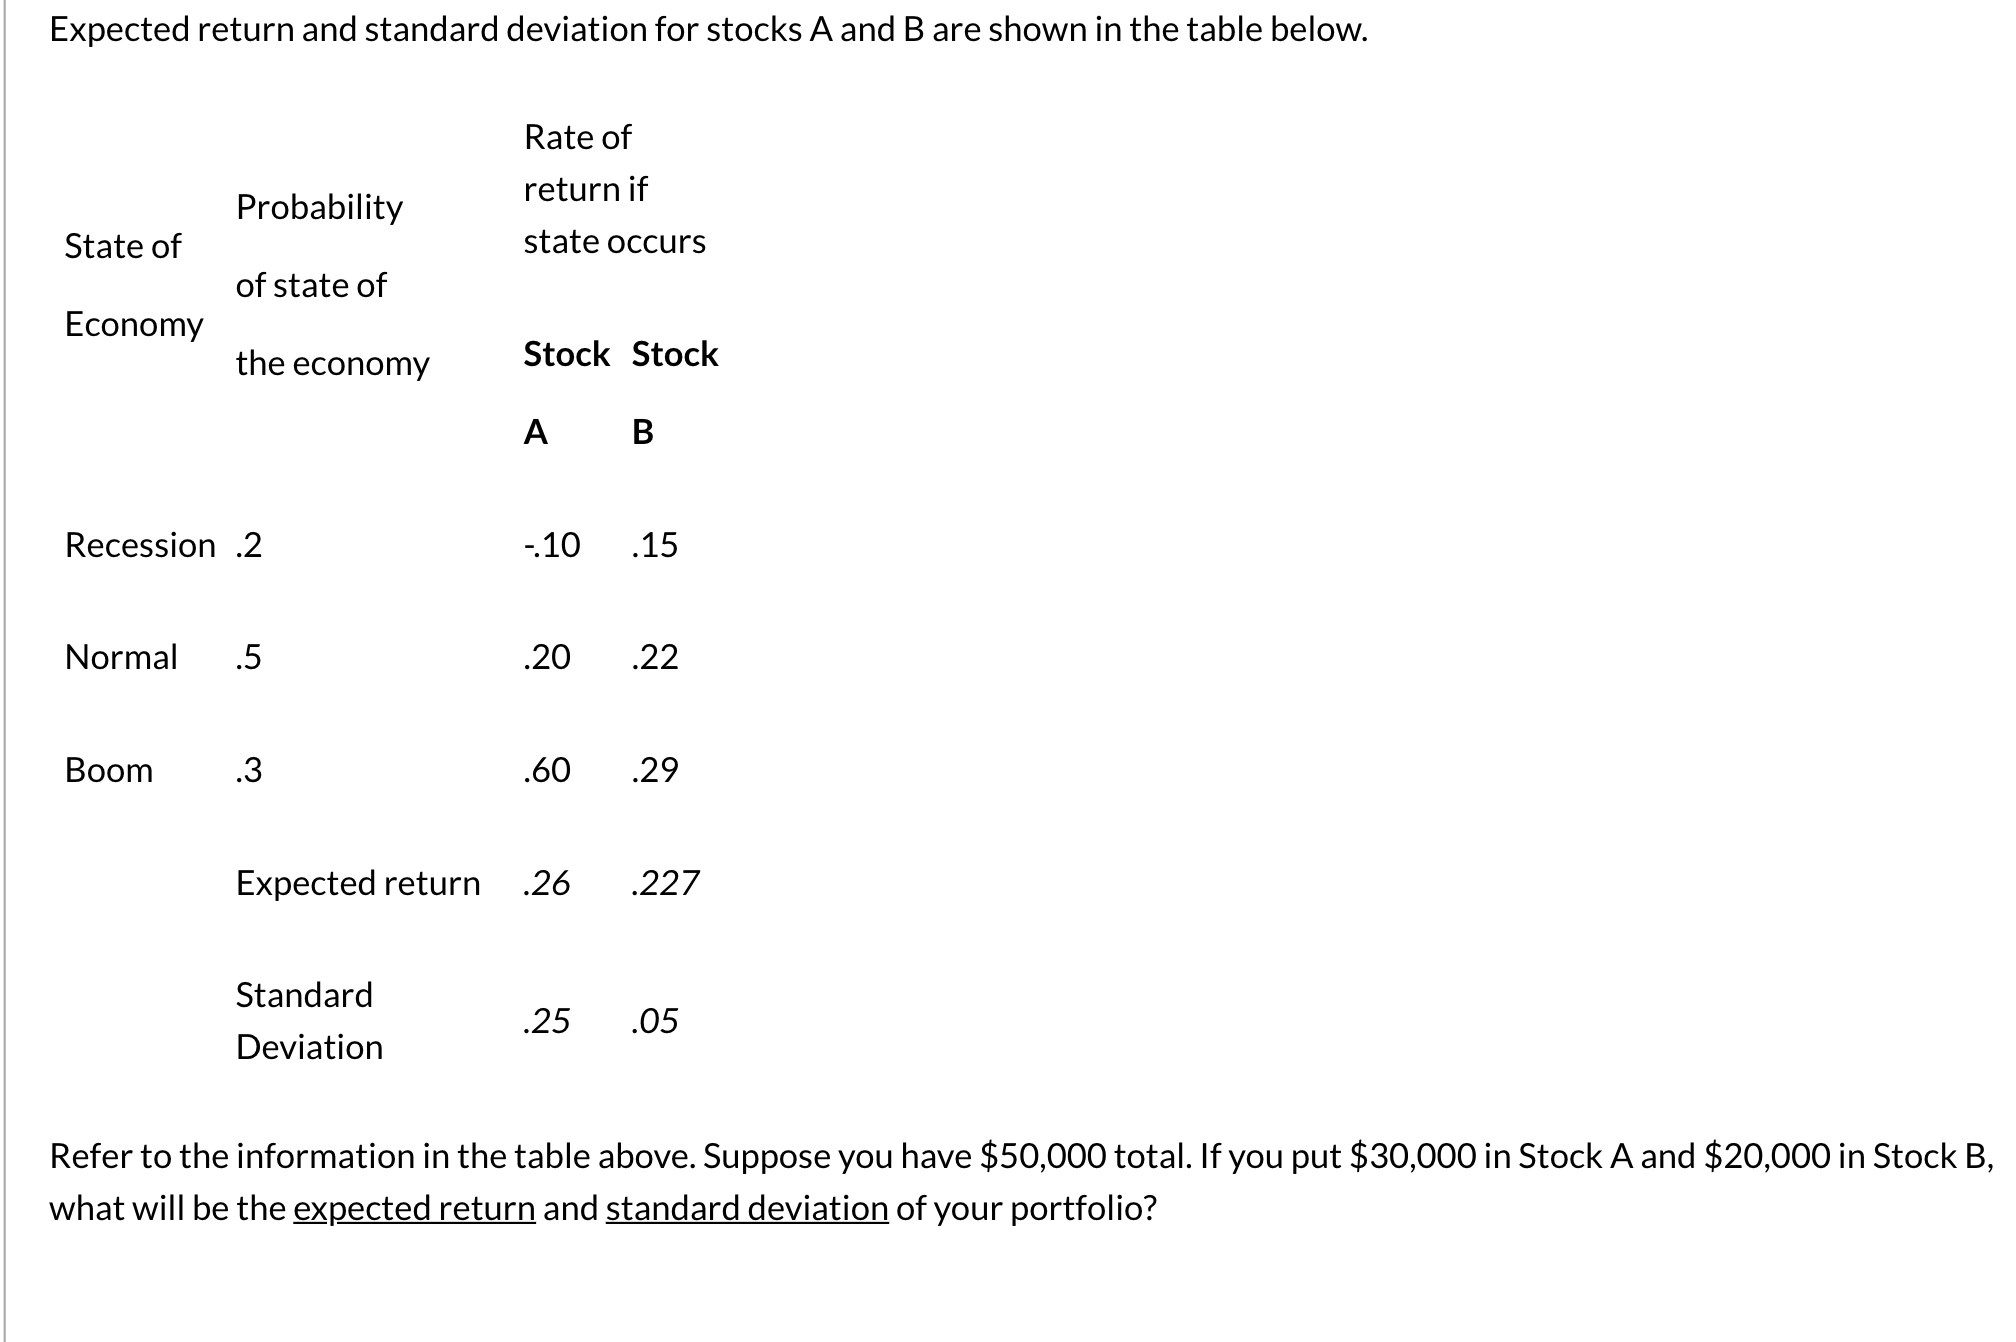
Expected return and standard deviation for stocks A and B are shown in the table below. Rate of return if Probability State of state occurs of state of Economy the economy Stock Stock A B Recession .2 -.10 .15 Normal .5 .20 .22 Boom .3 .60 .29 Expected return .26 .227 Standard Deviation .25 .05 Refer to the information in the table above. Suppose you have $50,000 total. If you put $30,000 in Stock A and $20,000 in Stock B, what will be the expected return and standard deviation of your portfolio?
Step by Step Solution
There are 3 Steps involved in it
To determine the expected return and standard deviation of the portfolio follow these steps Step 1 C... View full answer

Get step-by-step solutions from verified subject matter experts