

Question: Expected Return Expected Return Expected Return Probability 0.25 Best state Good state Normal state Poor state beta 40% 30% 20% 25% 20% 15% 10% 1.1
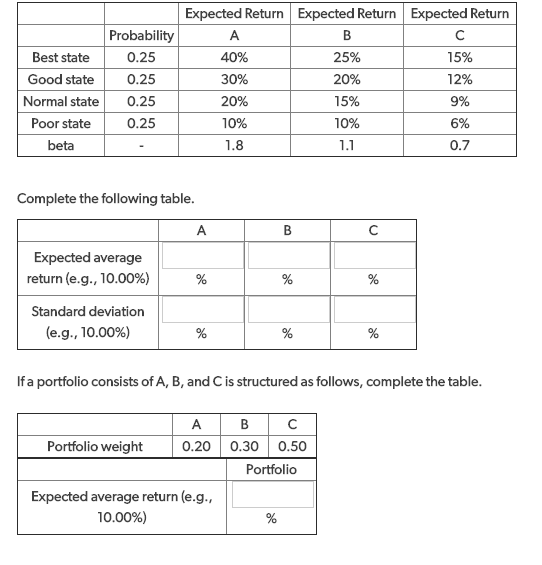
Expected Return Expected Return Expected Return Probability 0.25 Best state Good state Normal state Poor state beta 40% 30% 20% 25% 20% 15% 10% 1.1 15% 12% 9% 6% 0.25 0.25 10% 1.8 0.7 Complete the following table. A Expected average return (e.g., 10.00%) Standard deviation (e.g., 10.00%) If a portfolio consists of A, B, and is structured as follows, complete the table. 0.20 Portfolio weight 0.30 0.50 Portfolio Expected average return (e.g., 10.00%)
Step by Step Solution
There are 3 Steps involved in it
1 Expert Approved Answer
Step: 1 Unlock

Question Has Been Solved by an Expert!
Get step-by-step solutions from verified subject matter experts
Step: 2 Unlock
Step: 3 Unlock