

Question: Expected unit selling price is: Expected unit variable cost is: Expected total fixed costs are: $1,512,500 Requirecd 1. Calculate breakeven point in both units and
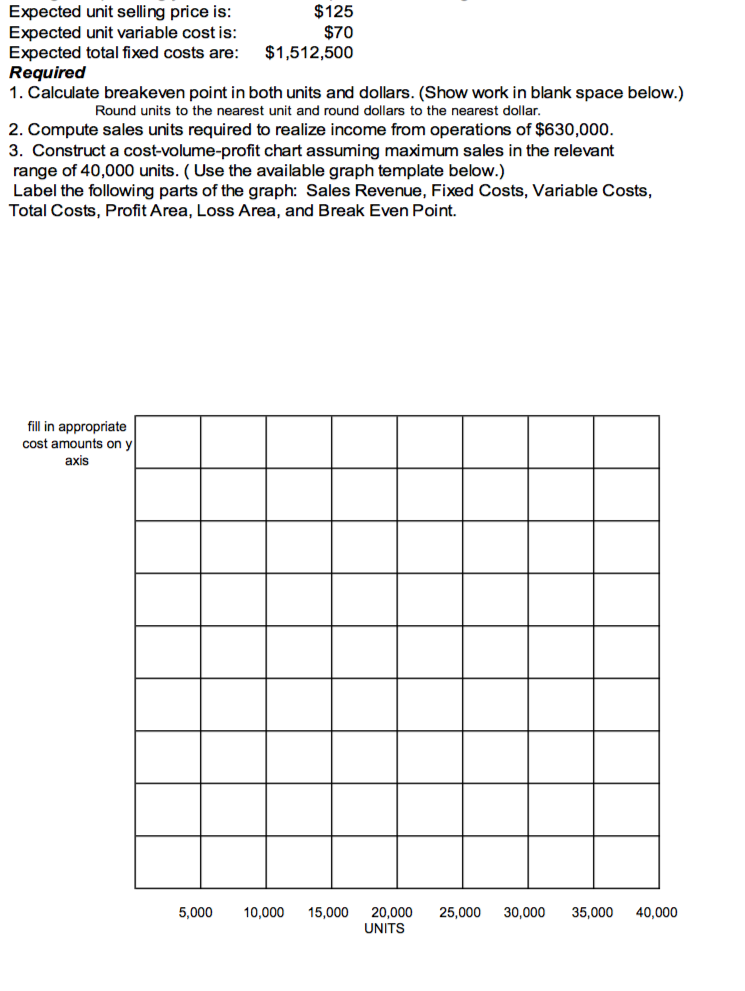
Expected unit selling price is: Expected unit variable cost is: Expected total fixed costs are: $1,512,500 Requirecd 1. Calculate breakeven point in both units and dollars. (Show work in blank space below.) $125 Round units to the nearest unit and round dollars to the nearest dollar 2. Compute sales units required to realize income from operations of $630,000. 3. Construct a cost-volume-profit chart assuming maximum sales in the relevant range of 40,000 units. ( Use the available graph template below.) Label the following parts of the graph: Sales Revenue, Fixed Costs, Variable Costs, Total Costs, Profit Area, Loss Area, and Break Even Point. fill in appropriate cost amounts on y axis 5,0000,000 5,000 20,000 25,000 30,000 35,000 40,000 UNITS
Step by Step Solution
There are 3 Steps involved in it

Get step-by-step solutions from verified subject matter experts