

Question: Expecter return St. Deviation Equity found (S) 20% 30% Bond found (B) 12% 15% The manager of a pension fund focuses on three mutual funds.
| Expecter return | St. Deviation | |
| Equity found (S) | 20% | 30% |
| Bond found (B) | 12% | 15% |
The manager of a pension fund focuses on three mutual funds. The first is an equity fund, the second is a bond fund which consists of long?term government bonds and corporate bonds and the third is a monetary fund which consists of T?bills yielding 8% . The characteristics of the two risky funds are: See table on top.
The correlation between the returns of these two funds is 0.10.
What is the portfolio composition of minimum variance of two risky funds? What are the expectation and the standard deviation of its returns?
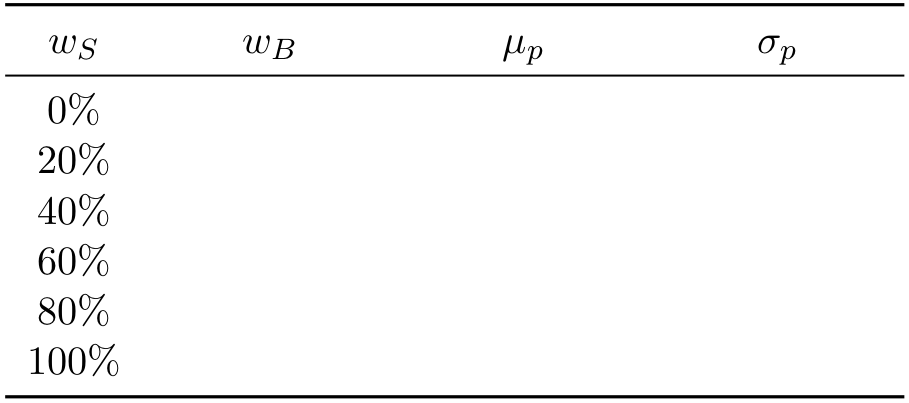
Complete the table below and graphically represent the universe of possible investments ments.
On the same graph, draw a tangent to the investment universe through the risk?free rate. Read on the chart the approximate values o?f the expected return and risk of the tangency portfolio (or optimal risky portfolio).
What is the composition of the tangency portfolio? What are its expected return and standard deviation?
What is the Sharpe ratio of the best straight capital allocation (capital allocation line)?
You can invest in the three funds, you want that your portfolio has 14% of profitability and be efficient. What is the standard deviation of your portfolio? What are the proportions invested in the money market fund and each of the two risky funds?
If you could invest in both risk funds and want to still get a portfolio whose profitability expectancy is 14%, what is the composition of your portfolio? What is the standard deviation of such a portfolio? Compare this to the standard deviation of the portfolio of the previous question and comment.
The manager of a pension fund focuses on three mutual funds. The first is an equity fund, the second is a bond fund which consists of long term government bonds and corporate bonds and the third is a monetary fund which consists of T½bills yielding 8% . The characteristics of the two risky funds are: See table on top. The correlation between the returns of these two funds is 0.10. What is the portfolio composition of minimum variance of two risky funds? What are the expectation and the standard deviation of its returns? Complete the table below and graphically represent the universe of possible investments ments. On the same graph, draw a tangent to the investment universe through the risk free rate. Read on the chart the approximate values o?f the expected return and risk of the tangency portfolio (or optimal risky portfolio). What is the composition of the tangency portfolio? What are its expected return and standard deviation? What is the Sharpe ratio of the best straight capital allocation (capital allocation line)? You can invest in the three funds, you want that your portfolio has 14% of profitability and be efficient. What is the standard deviation of your portfolio? What are the proportions invested in the money market fund and each of the two risky funds? If you could invest in both risk funds and want to still get a portfolio whose profitability expectancy is 14%, what is the composition of your portfolio? What is the standard deviation of such a portfolio? Compare this to the standard deviation of the portfolio of the previous question and comment. The manager of a pension fund focuses on three mutual funds. The first is an equity fund, the second is a bond fund which consists of long term government bonds and corporate bonds and the third is a monetary fund which consists of T½bills yielding 8% . The characteristics of the two risky funds are: See table on top. The correlation between the returns of these two funds is 0.10. What is the portfolio composition of minimum variance of two risky funds? What are the expectation and the standard deviation of its returns? Complete the table below and graphically represent the universe of possible investments ments. On the same graph, draw a tangent to the investment universe through the risk free rate. Read on the chart the approximate values o?f the expected return and risk of the tangency portfolio (or optimal risky portfolio). What is the composition of the tangency portfolio? What are its expected return and standard deviation? What is the Sharpe ratio of the best straight capital allocation (capital allocation line)? You can invest in the three funds, you want that your portfolio has 14% of profitability and be efficient. What is the standard deviation of your portfolio? What are the proportions invested in the money market fund and each of the two risky funds? If you could invest in both risk funds and want to still get a portfolio whose profitability expectancy is 14%, what is the composition of your portfolio? What is the standard deviation of such a portfolio? Compare this to the standard deviation of the portfolio of the previous question and comment
Step by Step Solution
There are 3 Steps involved in it

Get step-by-step solutions from verified subject matter experts