

Question: Experiment 2: Graphing and Measurements Report Sheet Version B use a metric ruler to make the required measurements) so you can calculate the volume for
Experiment 2: Graphing and Measurements
Report Sheet Version B
use a metric ruler to make the required measurements) so you can calculate the volume for each object.
Table I: Density of Different Objects (All objects are made of the same material.)
Determine the average density:
*Provide one sample calculation for the volume and density of the cube below.
Volume calculation:
Density calculation:
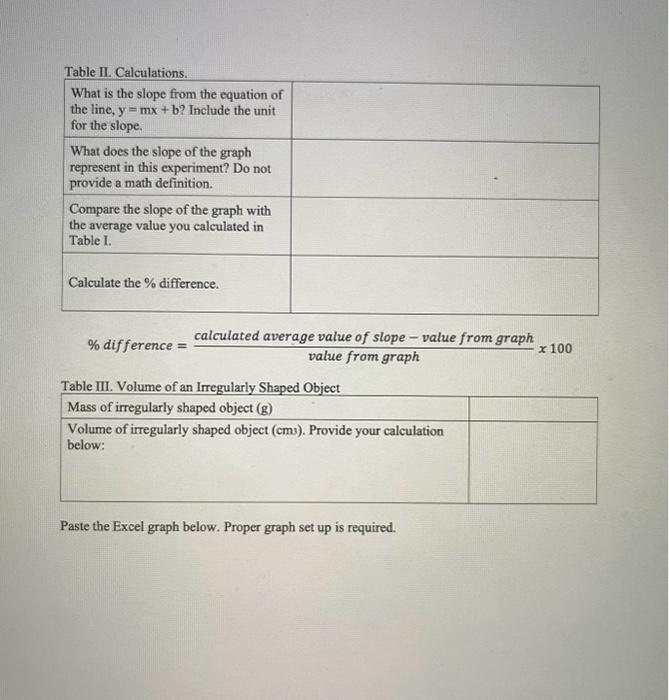
Table II: Calculations.
What is the slope from the equation of the
line, y = mx + b? Include the unit for the slope.
What does the slope of the graph represent in this experiment? Do not provide a math definition.
Compare the slope of the graph with the average value you calculated in Table I.
Calculate the % difference.
% difference=calculated average value of slope-value from graph x 100
Table III. Volume of an Irregularly Shaped Obiect
Mass of irregularly shaped object (g)
Volume of irregularly shaped object (cm3).
Provide your calculation below:
Paste the Excel graph below. Proper graph set up is required.
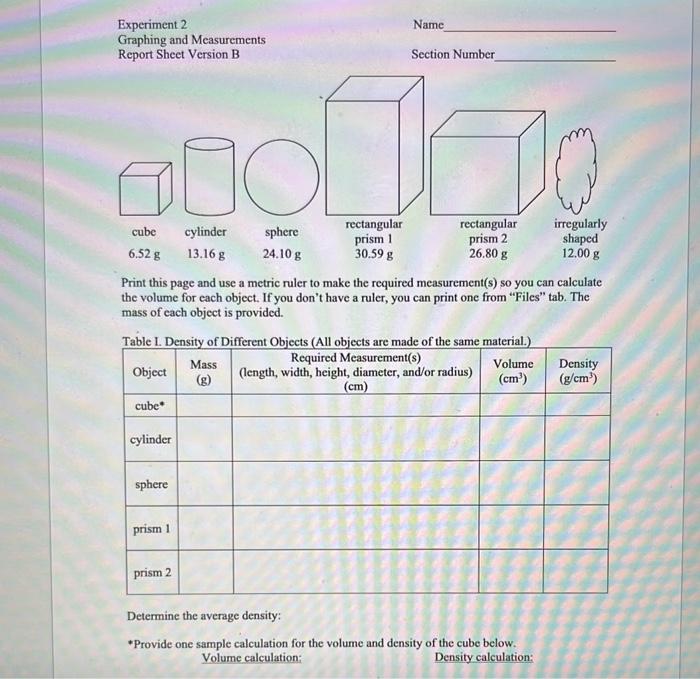
Experiment 2 Name Graphing and Measurements Report Sheet Version B Section Number Print this page and use a metric ruler to make the required measurement(s) so you can calculate the volume for each object. If you don't have a ruler, you can print one from "Files" tab. The mass of each object is provided. Table I. Densitv of Different Ohiects (All obiects are made of the same material.) Determine the average density: -Provide one sample calculation for the volume and density of the cube below. Volume calculation: Density calculation: % difference = value from graf Paste the Excel graph below. Proper graph set up is required. Experiment 2 Name Graphing and Measurements Report Sheet Version B Section Number Print this page and use a metric ruler to make the required measurement(s) so you can calculate the volume for each object. If you don't have a ruler, you can print one from "Files" tab. The mass of each object is provided. Table I. Densitv of Different Ohiects (All obiects are made of the same material.) Determine the average density: -Provide one sample calculation for the volume and density of the cube below. Volume calculation: Density calculation: % difference = value from graf Paste the Excel graph below. Proper graph set up is required
Step by Step Solution
There are 3 Steps involved in it

Get step-by-step solutions from verified subject matter experts