

Question: Experiment 8: The Grating Spectrometer Data: Spectrum Measurement Color ? 1 ? ? '1 ? 2 ? '2 Red - orange 19 56 Yellow 23
Experiment 8: The Grating Spectrometer
Data: Spectrum Measurement
Color | ?1? | ?'1 | ?2 | ?'2 |
| Red - orange | 19 | 56 | ||
| Yellow | 23 | 55 | 4 | 71 |
| Green | 22 | 52 | 5 | 71 |
| Teal | 22 | 54 | ||
| Blue | 26 | 51 | ||
| Blue-Violet | 27 | 49
|
1. Calculate the wavelength for each of the lines you measured. Recall that for each line you
measured the angle twice. To get the deflection angle, use equation 8.3.
2. Try to match your calculated wavelength values with the values in the table of accepted values. Calculate the percentage error for each wavelength calculation.

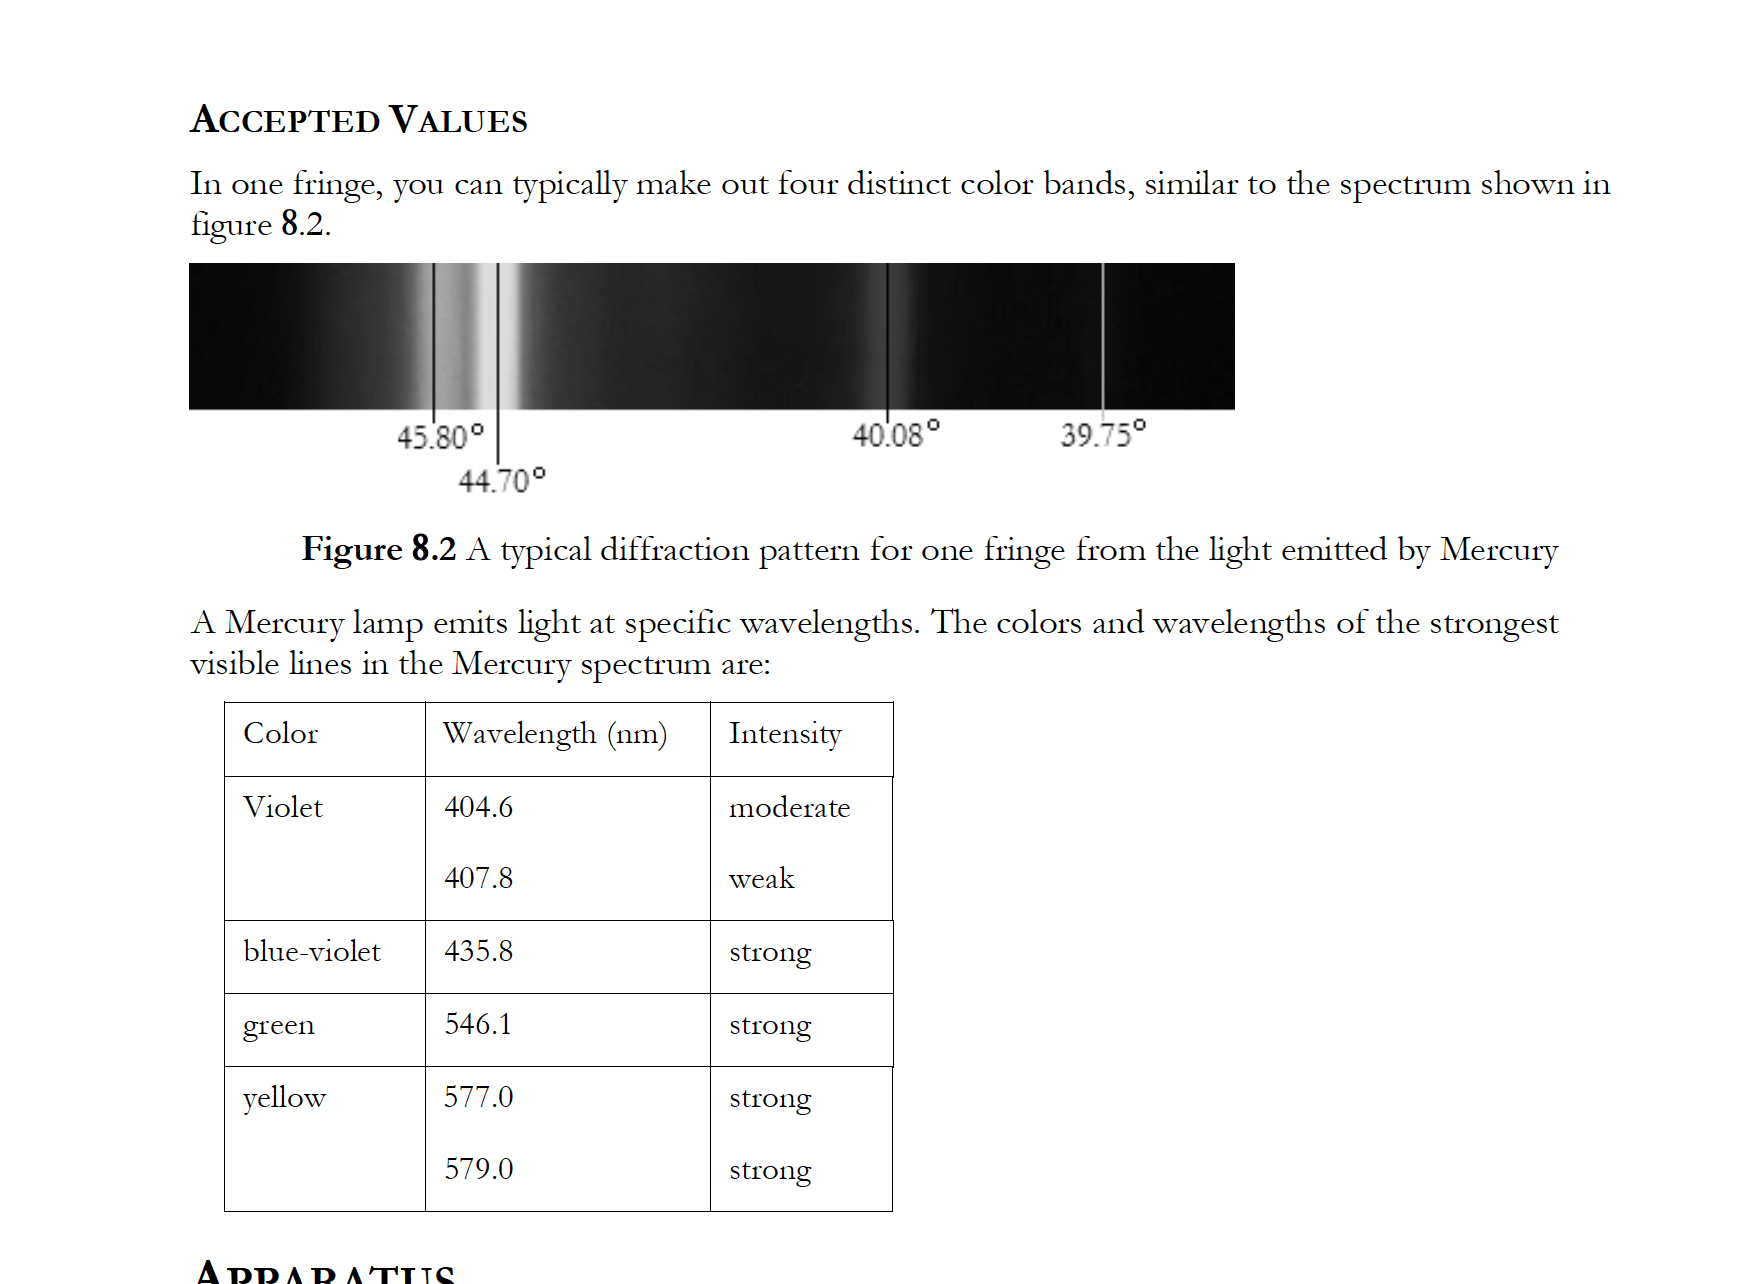
Deflection angle = 2ACCEPTED VALUES In one fringe, you can typically make out four distinct color bands, similar to the spectrum shown in figure 8.2. 45.80 40.08 39.750 44.70 Figure 8.2 A typical diffraction pattern for one fringe from the light emitted by Mercury A Mercury lamp emits light at specific wavelengths. The colors and wavelengths of the strongest visible lines in the Mercury spectrum are: Color Wavelength (nm) Intensity Violet 404.6 moderate 407.8 weak blue-violet 435.8 strong green 546.1 strong yellow 577.0 strong 579.0 strong ADD A
Step by Step Solution
There are 3 Steps involved in it

Get step-by-step solutions from verified subject matter experts