

Question: Experimental data from the DoE should enable the team to compute a set of important metrics. The table below ( Main Metrics ) summarises the
Experimental data from the DoE should enable the team to compute a set of important metrics. The table below Main Metrics summarises the values for the rate of defective handles, the average number of defects per handle defects per unit DPU the number of DPMO and the Sigma Level.
However, the team need your support to compute these important metrics. Please complete the table for them showing workings for calculations.
tableCasting Experiment Resul,,,,Structural Abnormailites,Filling Errors,Solidification shrinkages,Pores,Buried Extractor,Scoria and impurities,All Other
tableMain Metrics,Number of handles produced PTotal defective handles DTotal number of defects,Number of opportunities for defect ORate of defectives DPUSigma Level ZDPMOMean of defects,SD of defects,
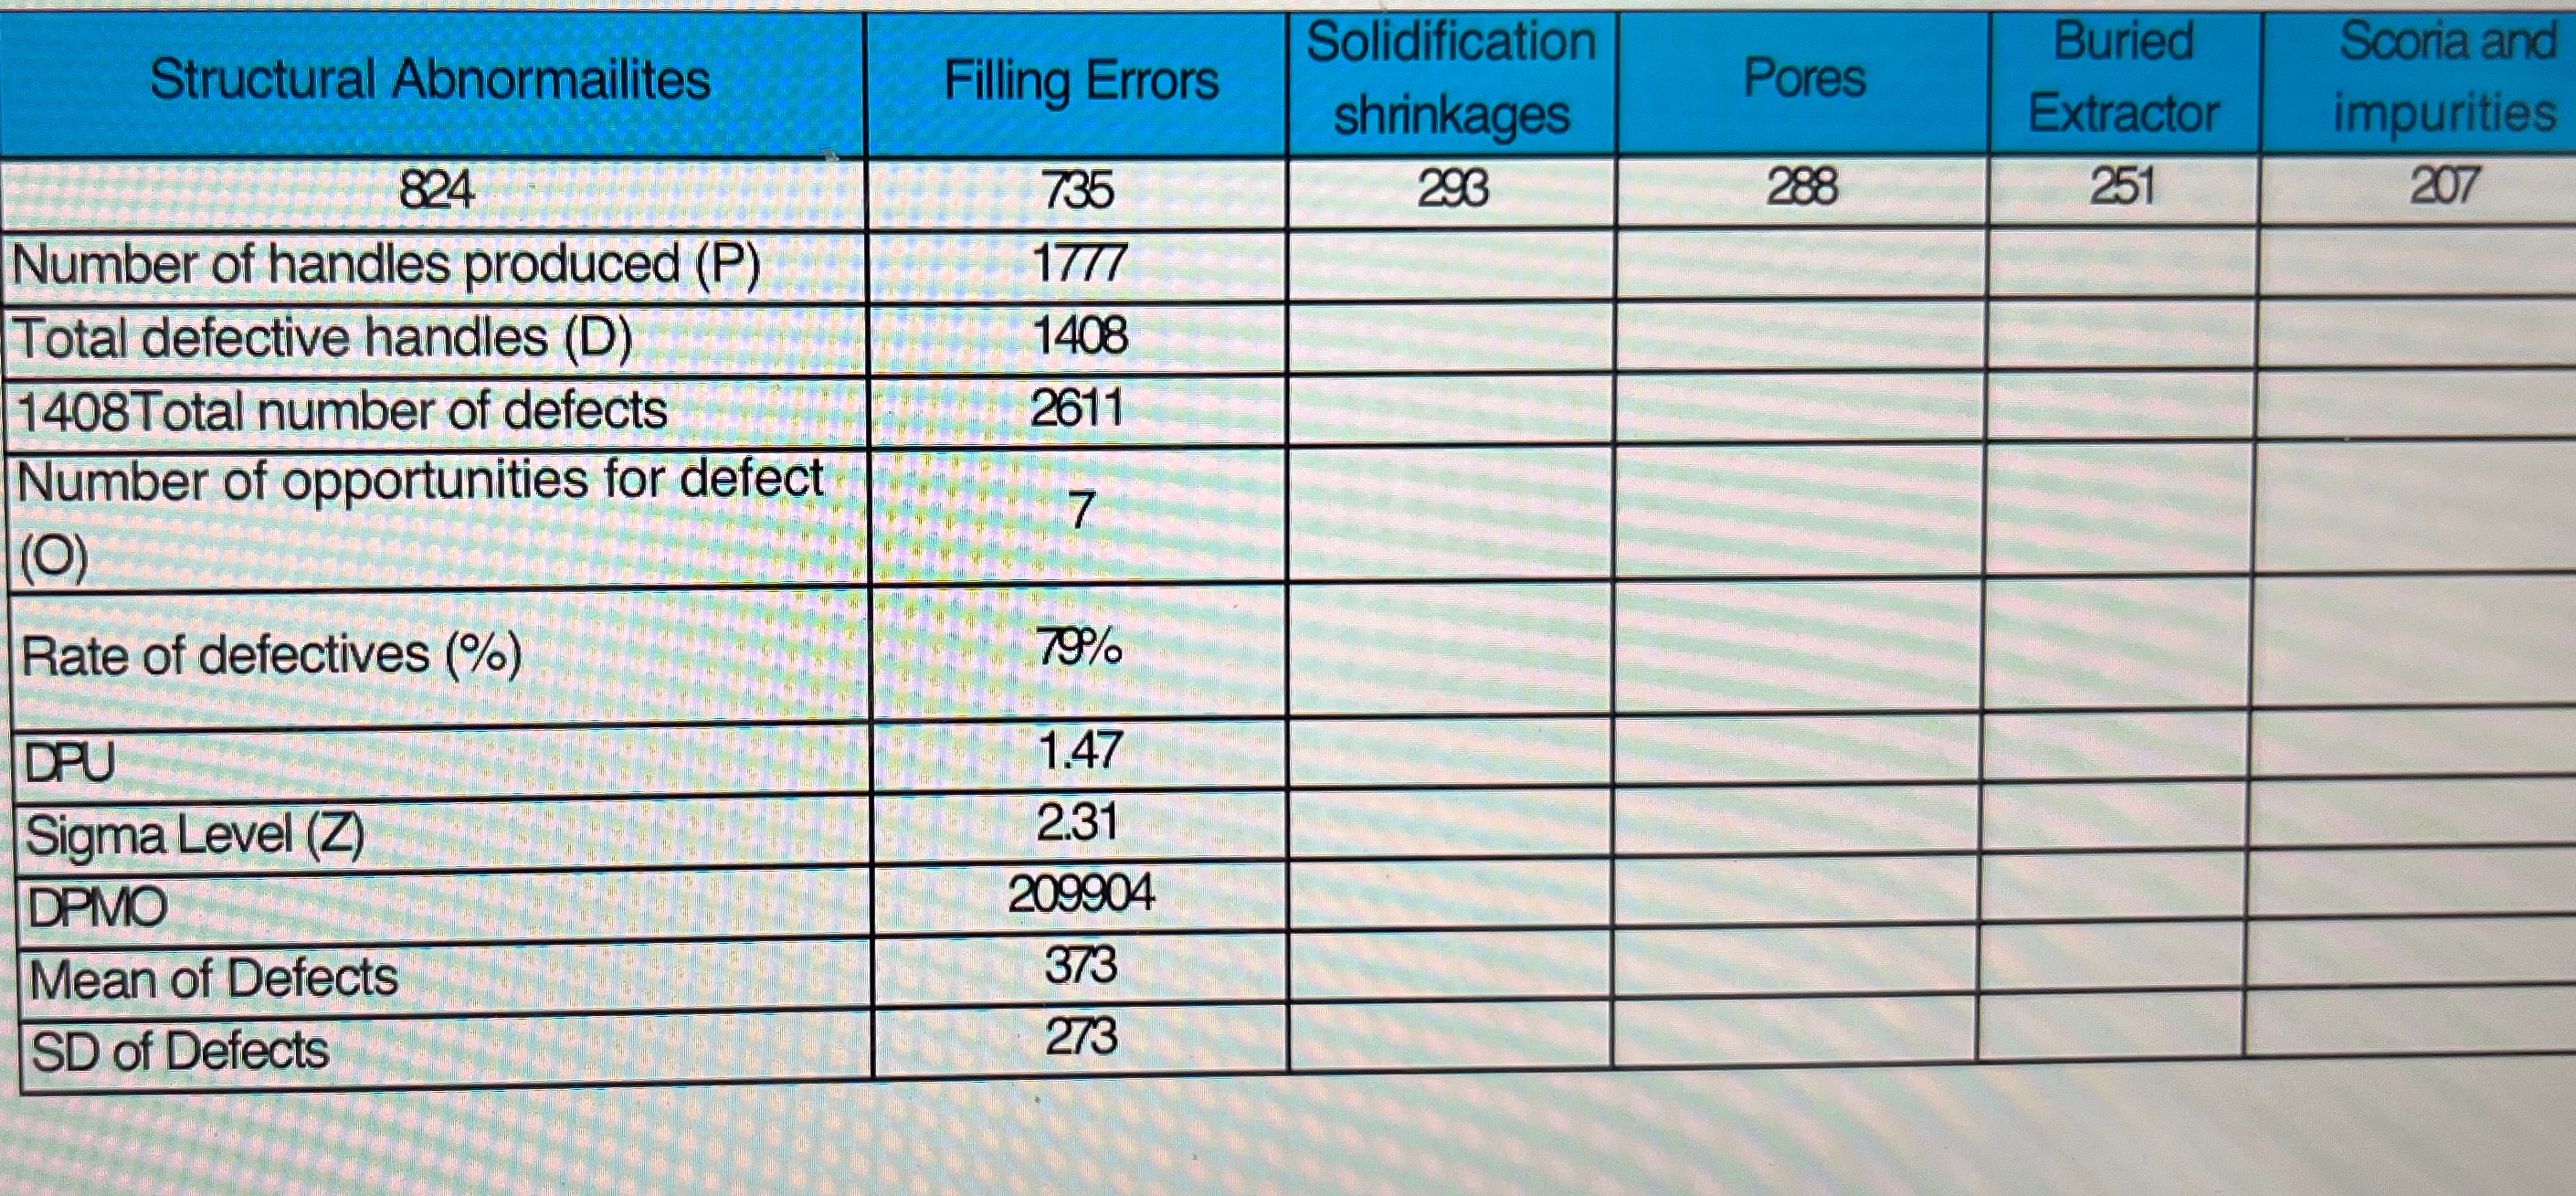
Base on this I have the following results: Have do you calculate the SD and Sigma Z value?
tableStructural Abnormailites,Filling Errors,tableSolidificationshrinkagesPores,tableBuriedExtractortableScoria andimpuritiesNumber of handles produced PTotal defective handles DTotal number of defects,tableNumber of opportunities for defectORate of defectives DPUSigma Level ZDPMOMean of Defects,SD of Defects,
How can I calculate the SD and Sigma Z value? I have been provided these results.
Step by Step Solution
There are 3 Steps involved in it
1 Expert Approved Answer
Step: 1 Unlock

Question Has Been Solved by an Expert!
Get step-by-step solutions from verified subject matter experts
Step: 2 Unlock
Step: 3 Unlock