

Question: EXPERIMENTAL DESIGN AND ANALYSIS*do not use any solver *solve it manually step by step 3. An automobile manufacturer wished to study the effects of differences
EXPERIMENTAL DESIGN AND ANALYSIS*do not use any solver *solve it manually step by step
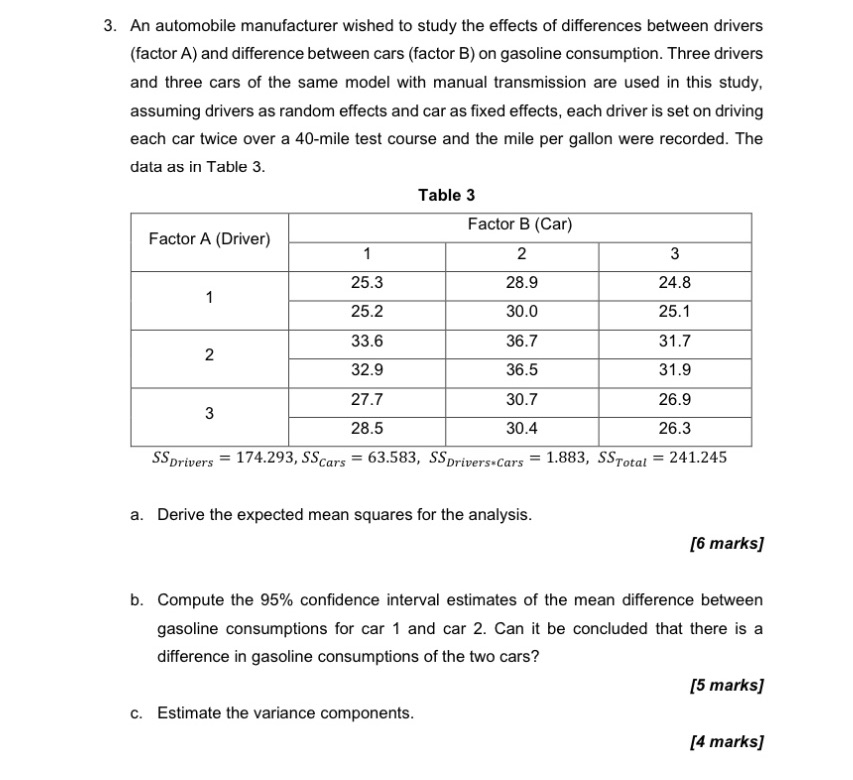
3. An automobile manufacturer wished to study the effects of differences between drivers (factor A) and difference between cars (factor B) on gasoline consumption. Three drivers and three cars of the same model with manual transmission are used in this study, assuming drivers as random effects and car as fixed effects, each driver is set on driving each car twice over a 40-mile test course and the mile per gallon were recorded. The data as in Table 3. Table 3 Factor B (Car) Factor A (Driver) 1 2 3 25.3 28.9 24.8 25.2 30.0 25.1 33.6 36.7 31.7 2 32.9 36.5 31.9 27.7 30.7 26.9 3 28.5 30.4 26.3 SS Drivers = 174.293, SScars = 63.583, SSDrivers.Cars = 1.883, SSTotal = 241.245 a. Derive the expected mean squares for the analysis. [6 marks] b. Compute the 95% confidence interval estimates of the mean difference between gasoline consumptions for car 1 and car 2. Can it be concluded that there is a difference in gasoline consumptions of the two cars? [5 marks] c. Estimate the variance components. [4 marks]
Step by Step Solution
There are 3 Steps involved in it

Get step-by-step solutions from verified subject matter experts