

Question: Experimental Design Interpretation A single replicate 2 4 experiment is designed. The experiment has factors A, B, C, and D, each of which can be
Experimental Design Interpretation
A single replicate 24 experiment is designed. The experiment has factors A, B, C, and D, each of which can be set to +1 or -1. We conduct a single replicate of this experiment, collecting the response for each possible combination of factor settings. We compute the factorial and interaction effects from this data, and determine that the following effects are significant:
- Factorial Effect C = -6.715
- Factorial Effect D = -12.108
- Interaction Effect CD = 9.452
Compute the residuals for this model; which of the following normal probability plots represent these residuals?
| Treatment Combination | Factor A | Factor B | Factor C | Factor D | Response |
| -1 | -1 | -1 | -1 | -1 | 5.18 |
| d | -1 | -1 | -1 | 1 | -15.21 |
| c | -1 | -1 | 1 | -1 | -11.14 |
| cd | -1 | -1 | 1 | 1 | -14.26 |
| b | -1 | 1 | -1 | -1 | 5.71 |
| bd | -1 | 1 | -1 | 1 | -17.64 |
| bc | -1 | 1 | 1 | -1 | -11.95 |
| bcd | -1 | 1 | 1 | 1 | -13.21 |
| a | 1 | -1 | -1 | -1 | 4.39 |
| ad | 1 | -1 | -1 | 1 | -16.52 |
| ac | 1 | -1 | 1 | -1 | -10.68 |
| acd | 1 | -1 | 1 | 1 | -13.13 |
| ab | 1 | 1 | -1 | -1 | 5.2 |
| abd | 1 | 1 | -1 | 1 | -16.39 |
| abc | 1 | 1 | 1 | -1 | -10.42 |
| abcd | 1 | 1 | 1 | 1 | -14.21 |
Group of answer choices
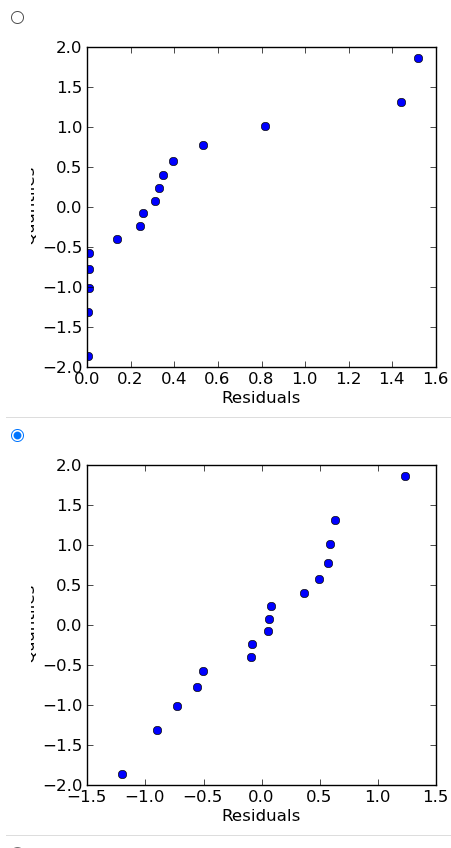
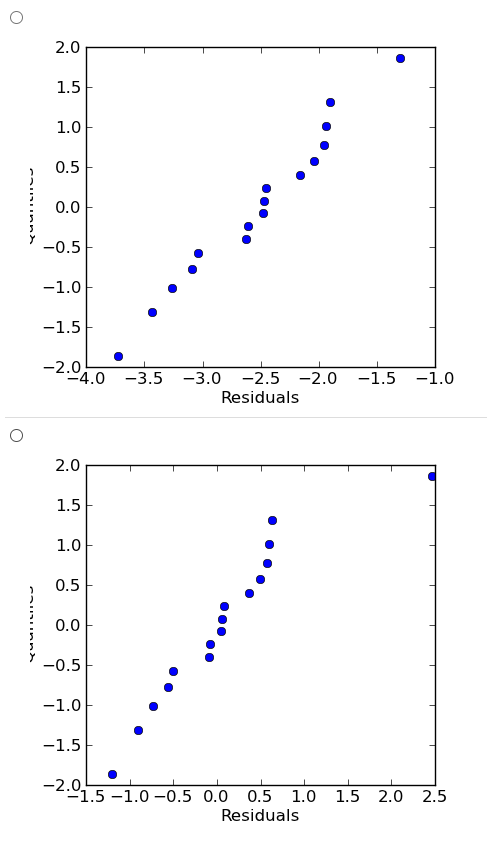
2.0 1.5 1.0 . 0.5 0.0 -0.5 -1.0 -1.5 -2.8.0 0.2 0.4 0.6 0.8 1.0 Residuals 1.2 1.4 1.6 2.0 1.5 1.0 0.5 0.0 : -0.5 -1.0 -1.5 -2.0, -1.5 -1.0 1.0 1.5 -0.5 0.0 0.5 Residuals 2.0 1.5 1.0 0.5 0.0 -0.5 -1.0 -1.5 -2.0 -4.0 -1.5 -1.0 -3.5 -3.0 -2.5 -2.0 Residuals 2.0 1.5 1.0 - 0.5 0.0 -0.5 -1.0 -1.5 -2.0 -1.5 -1.0 -0.5 0.0 0.5 1.0 1.5 2.0 2.5 Residuals
Step by Step Solution
There are 3 Steps involved in it

Get step-by-step solutions from verified subject matter experts