

Question: Expert Q&A Done 2.8: Open a blank spreadsheet in Excel and enter your data for A and 1/f in two separate columns. Refer back to
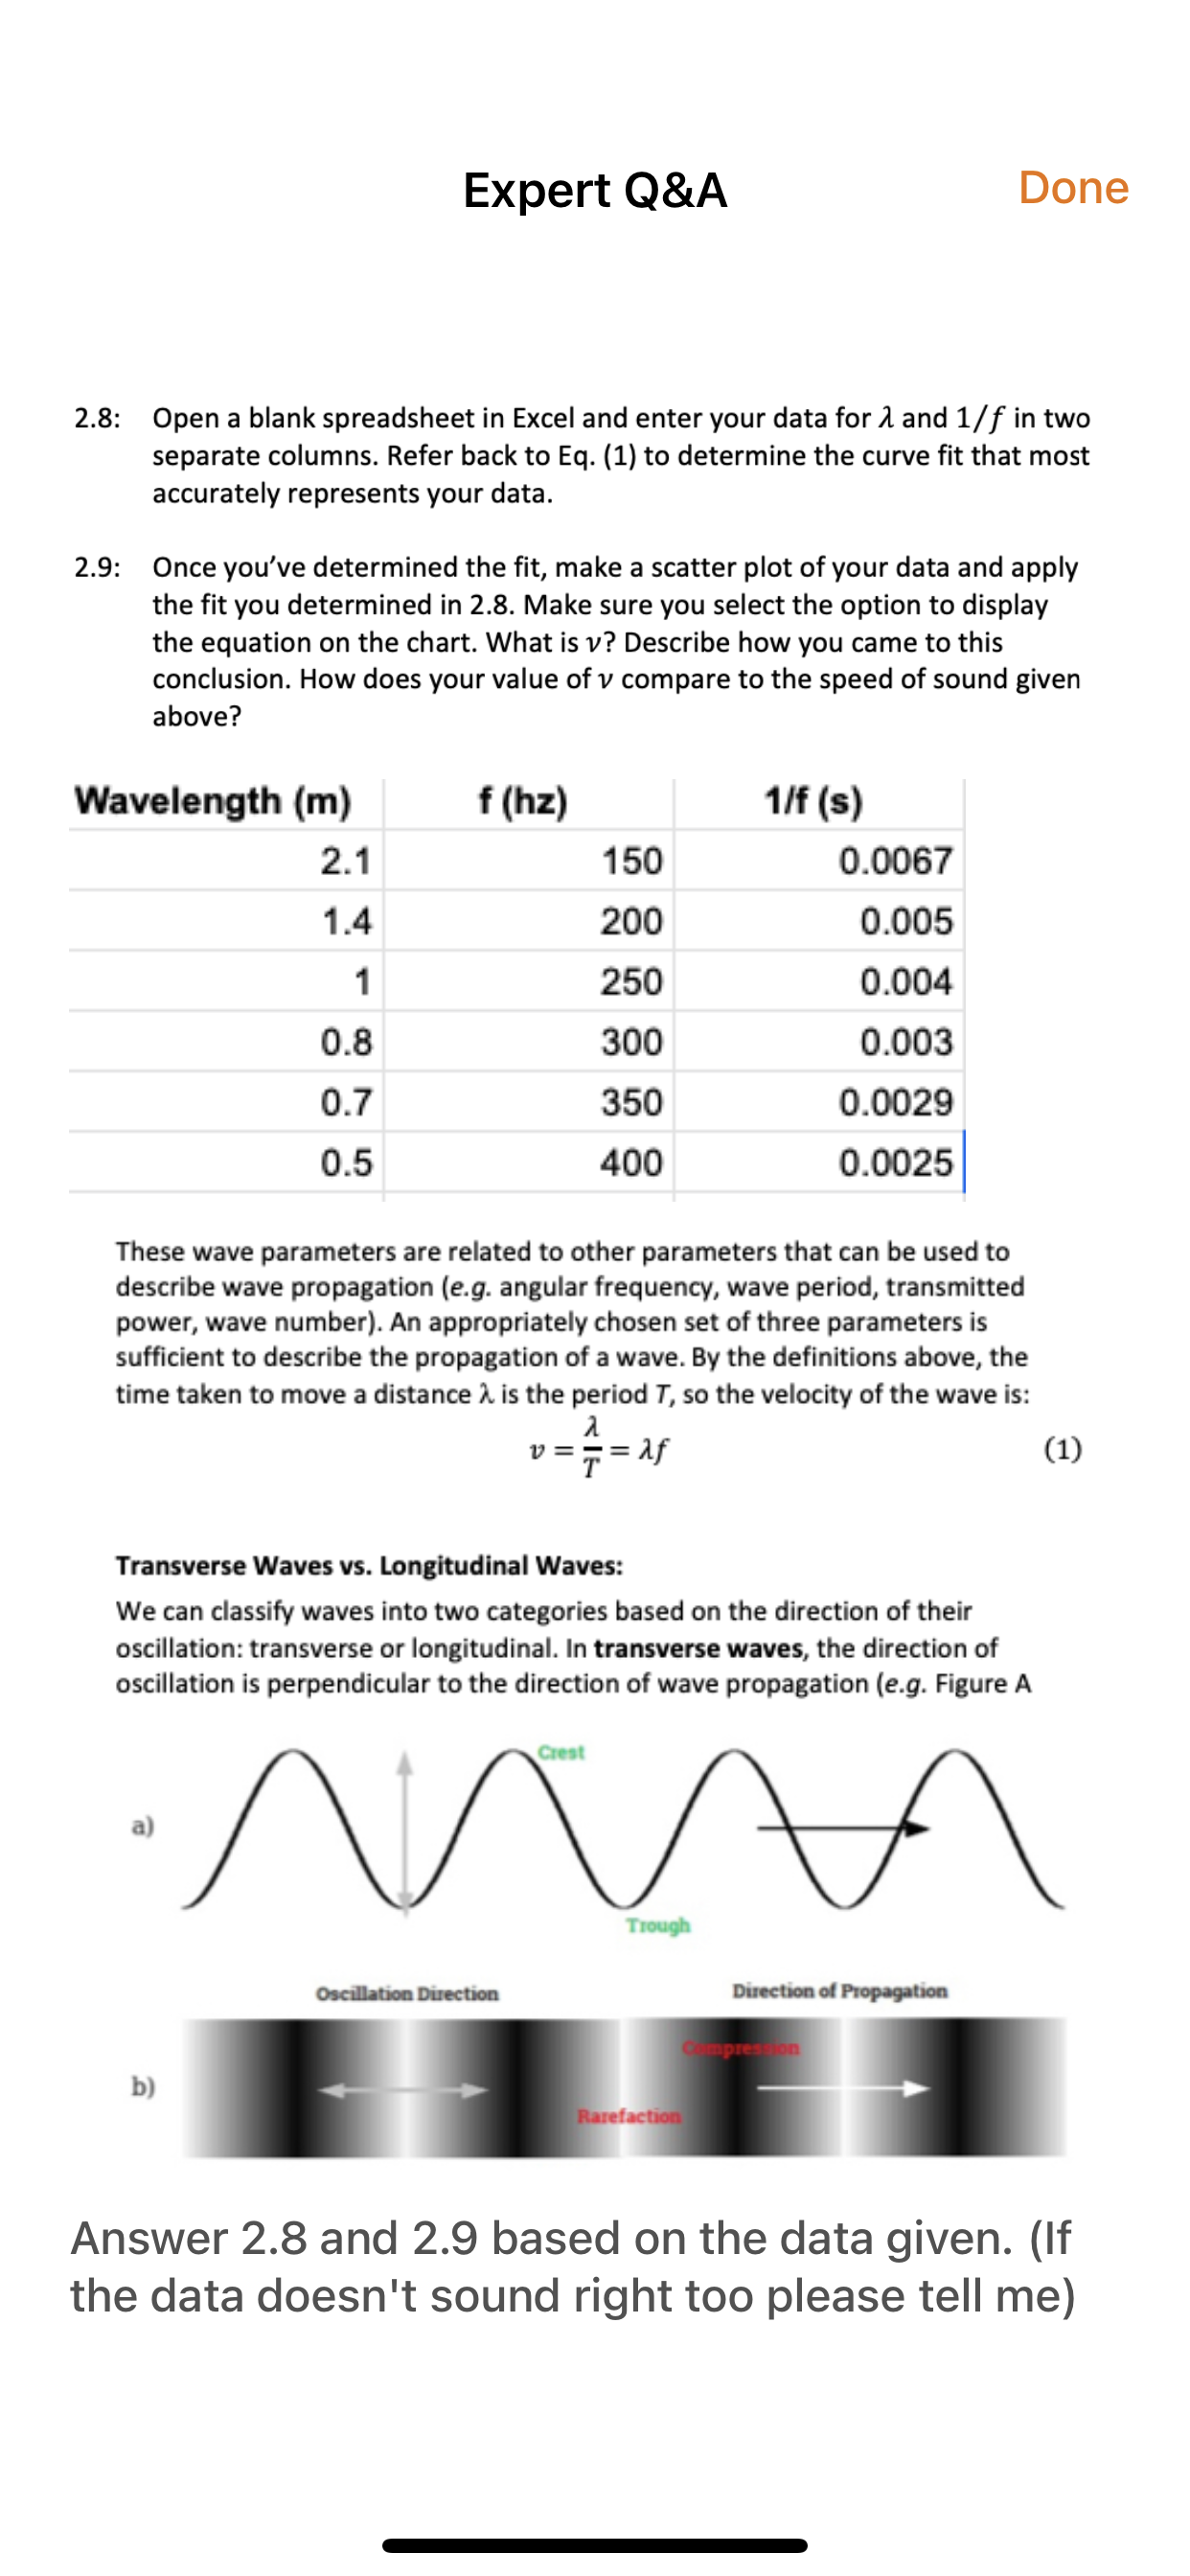
Expert Q&A Done 2.8: Open a blank spreadsheet in Excel and enter your data for A and 1/f in two separate columns. Refer back to Eq. (1) to determine the curve t that most accurately represents your data. 2.9: Once you've determined the t, make a scatter plot of your data and apply the fit you determined in 2.8. Make sure you select the option to display the equation on the chart. What is v? Describe how you came to this conclusion. How does your value of v compare to the speed of sound given above? Wavelength (m) f (ha) 1!! (s) 2.1 150 0.0067 1 .4 200 0.005 1 250 0.004 0.8 300 0.003 0.7 350 0.0029 0.5 400 0.0025 These wave parameters are related to other parameters that can be used to describe wave propagation leg. angular frequency, wave period, transmitted power, wave number). An appropriately chosen set of three parameters is sufficient to describe the propagation of a wave. By the definitions above, the time taken to move a distance i. is the period T, so the velocity of the wave is: A v = f = [if (1) Tramverse Waves vs. longitudinal Waves: We can classify waves into two categories based on the direction of their oscillation: transverse or longitudinal. In transverse waves, the direction of oscillation is perpendicular to the direction of wave propagation (e.g. Figure A Out a) le \"a\" min-Fli- b) Answer 2.8 and 2.9 based on the data given. (If the data doesn't sound right too please tell me)
Step by Step Solution
There are 3 Steps involved in it

Get step-by-step solutions from verified subject matter experts