

Question: explain all steps Table: DoNothing Initial Week 1 Week 2 Week 3 Week 4 Week 5 Week 6 Week 7 Week 8 Week 9 Week
explain all steps
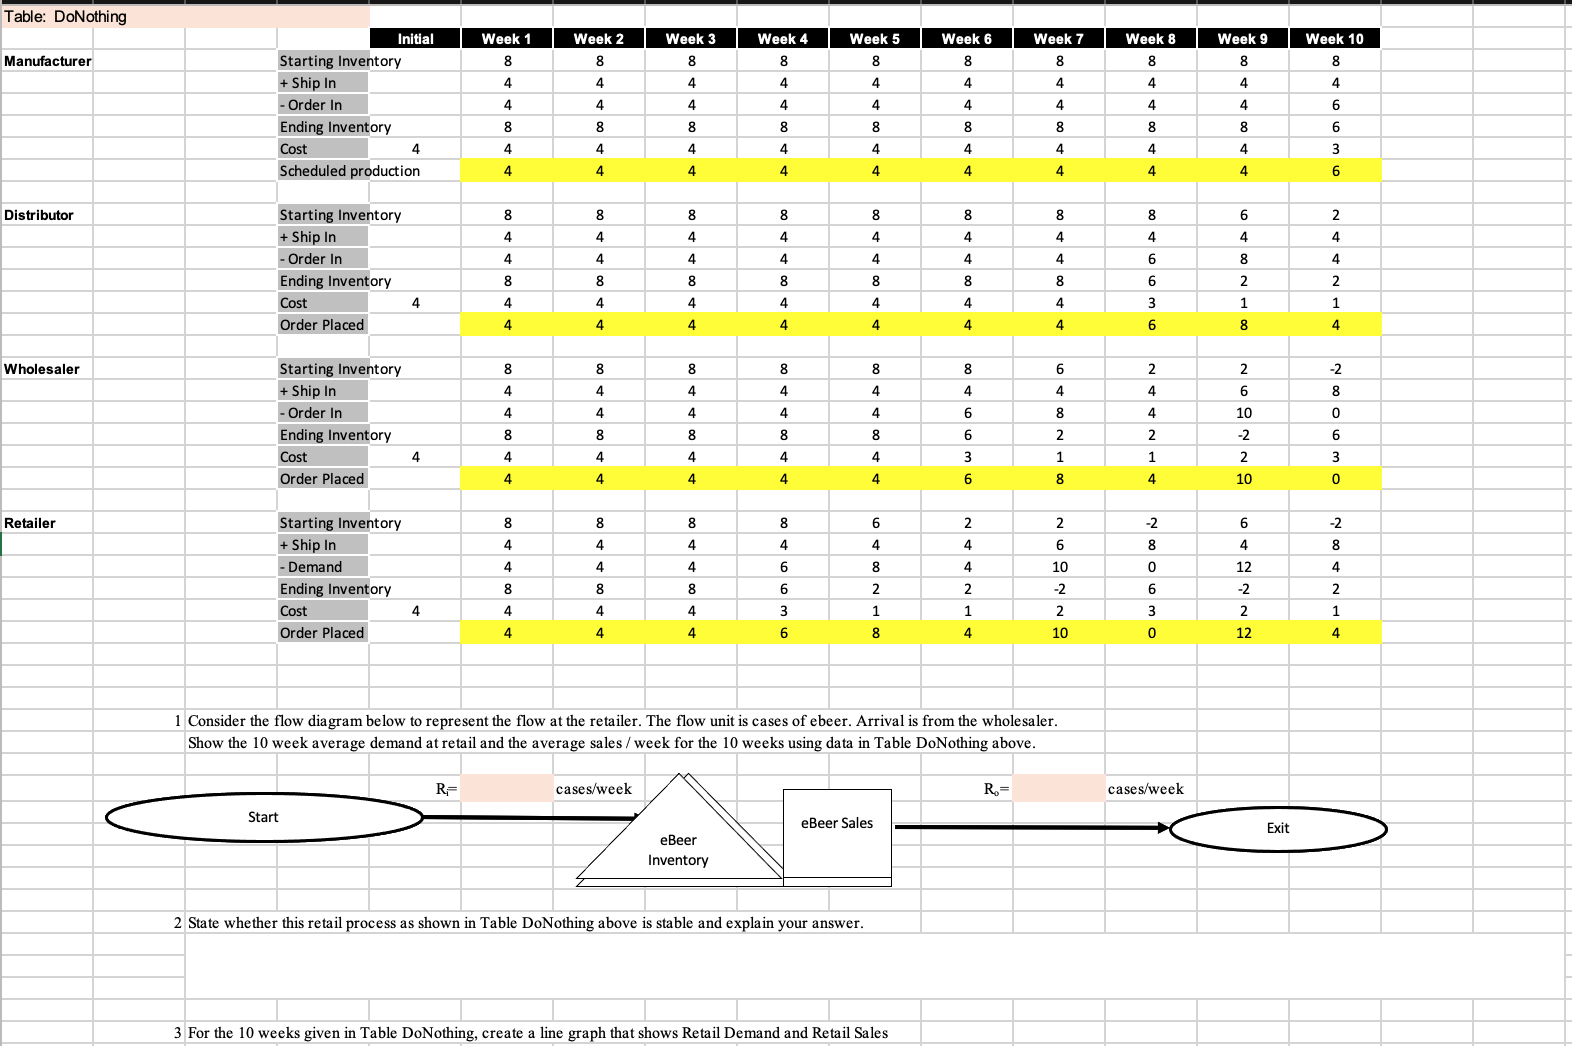
Table: DoNothing Initial Week 1 Week 2 Week 3 Week 4 Week 5 Week 6 Week 7 Week 8 Week 9 Week 10 8 LO B Manufacturer Starting Inventory o + Ship In Order In O W O O P Ending Inventory Cost 4 Scheduled production Distributor Starting Inventory + Ship In - Order In PHNAAN Ending Inventory Cost 4 Order Placed Wholesaler Starting Inventory + Ship In - Order In O W T O OO N 00 N OO A PHNAAN Ending Inventory Cost 4 Order Placed Retailer Starting Inventory + Ship In H ND OO N - Demand NNOON 00 H N OO NNNRAM O W O OO N PHNAAN Ending Inventory Cost 4 Order Placed 10 Consider the flow diagram below to represent the flow at the retailer. The flow unit is cases of ebeer. Arrival is from the wholesaler. Show the 10 week average demand at retail and the average sales / week for the 10 weeks using data in Table DoNothing above. R= cases/week R.= cases/week Start eBeer Sales Exit Beer Inventory 2 State whether this retail process as shown in Table DoNothing above is stable and explain your answer. 3 For the 10 weeks given in Table DoNothing, create a line graph that shows Retail Demand and Retail Sales
Step by Step Solution
There are 3 Steps involved in it

Get step-by-step solutions from verified subject matter experts