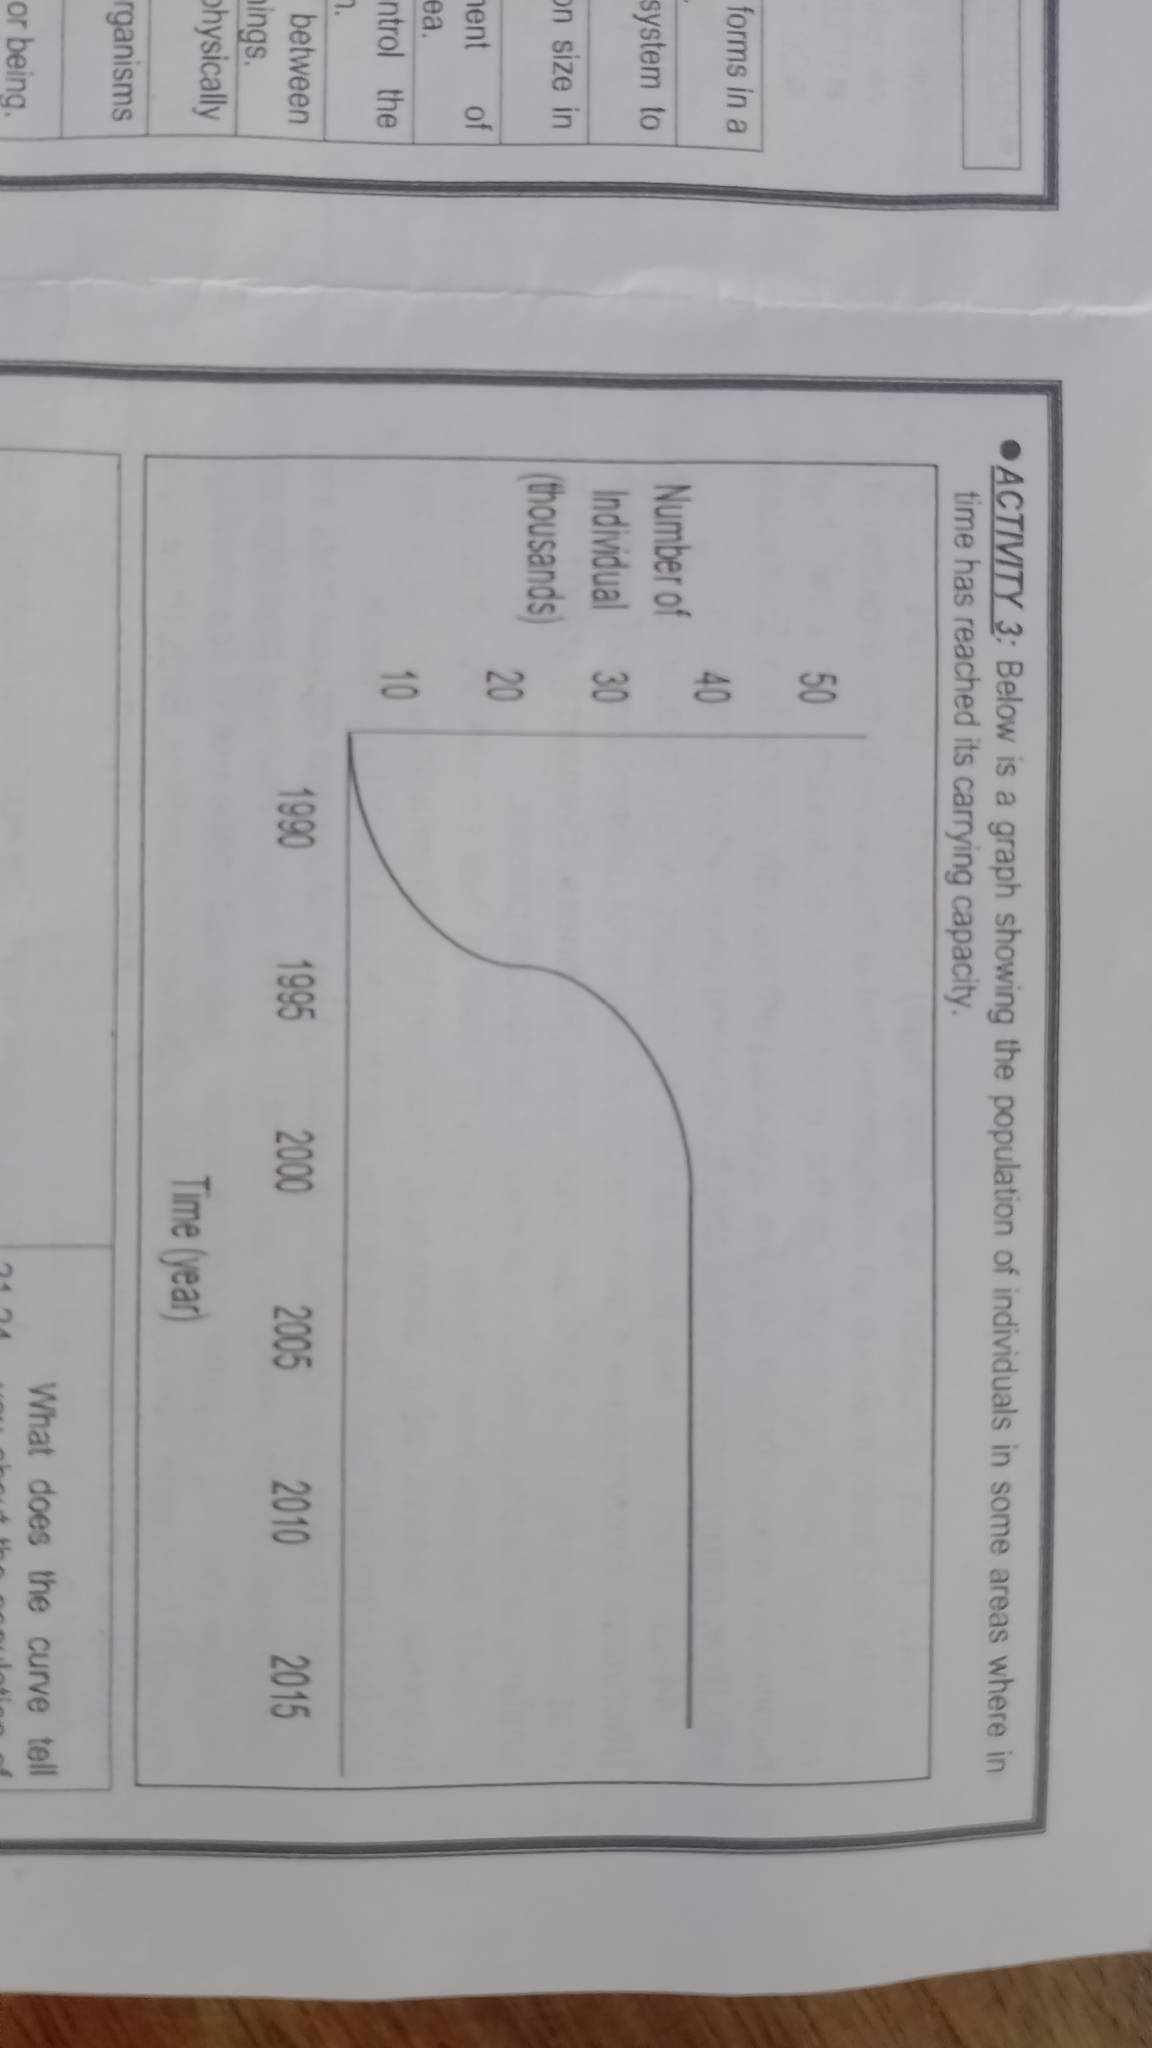
Question: explain and answer . ACTIVITY 3: Below is a graph showing the population of individuals in some areas where in time has reached its carrying

explain and answer

explain and answer . ACTIVITY 3: Below is a graph
. ACTIVITY 3: Below is a graph showing the population of individuals in some areas where in time has reached its carrying capacity. forms in a system to Number of Individual 8 n size in (thousands) ent 2 ntrol the between 9 90 ings. hysically Time (year) ganisms or being What does the curve tell

Step by Step Solution

There are 3 Steps involved in it

1 Expert Approved Answer
Step: 1 Unlock blur-text-image
Question Has Been Solved by an Expert!

Get step-by-step solutions from verified subject matter experts

Step: 2 Unlock
Step: 3 Unlock

Students Have Also Explored These Related Business Writing Questions!