

Question: explain and show all work use Matlab all previous answers are wrong so don't use them or I will give you a thumbs down and
explain and show all work use Matlab all previous answers are wrong so don't use them or I will give you a thumbs down and report you
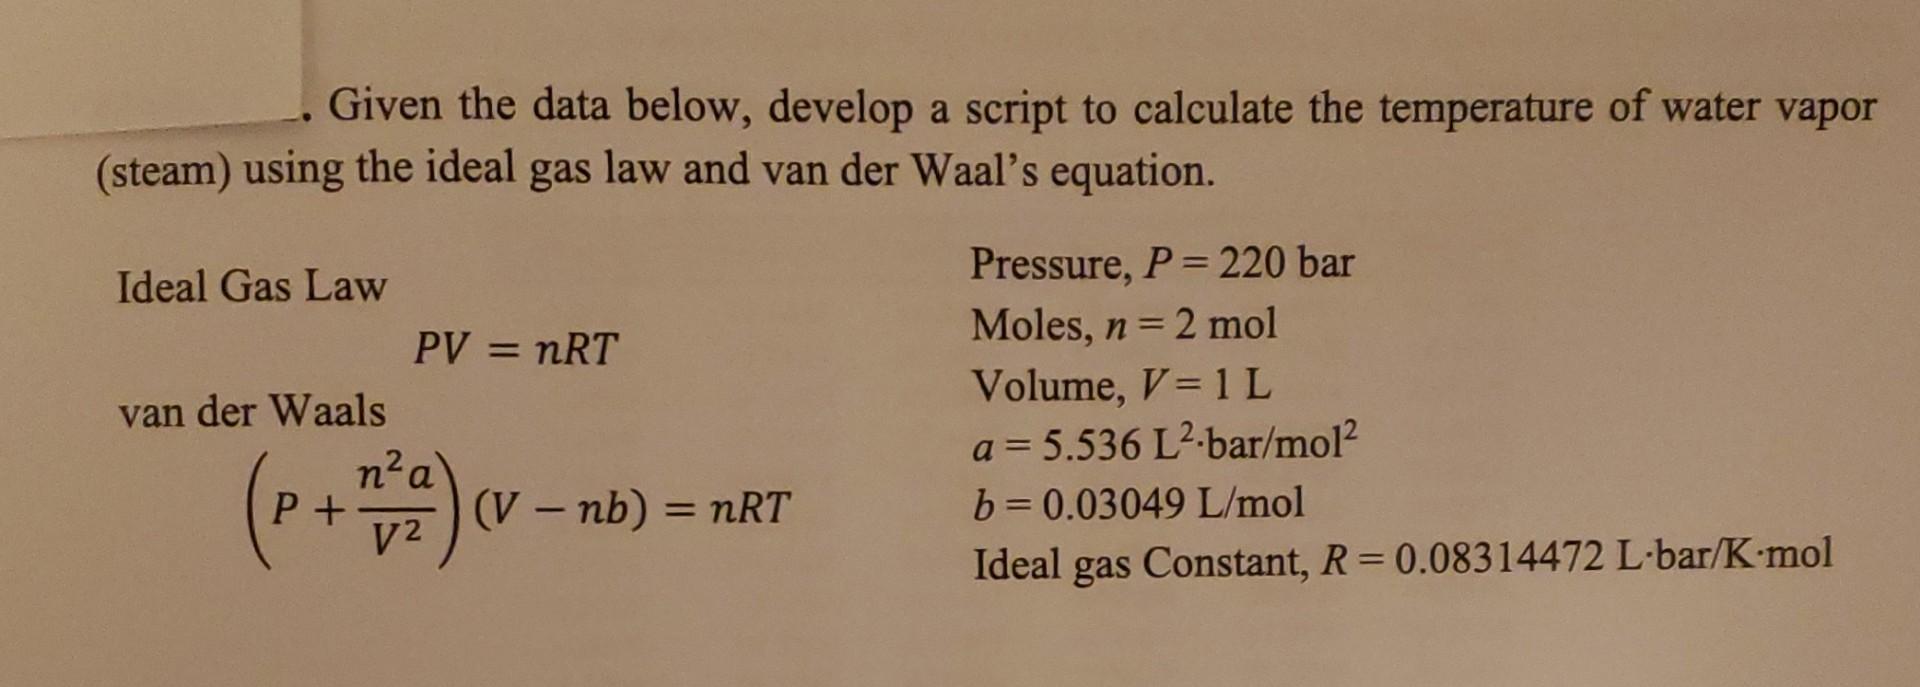
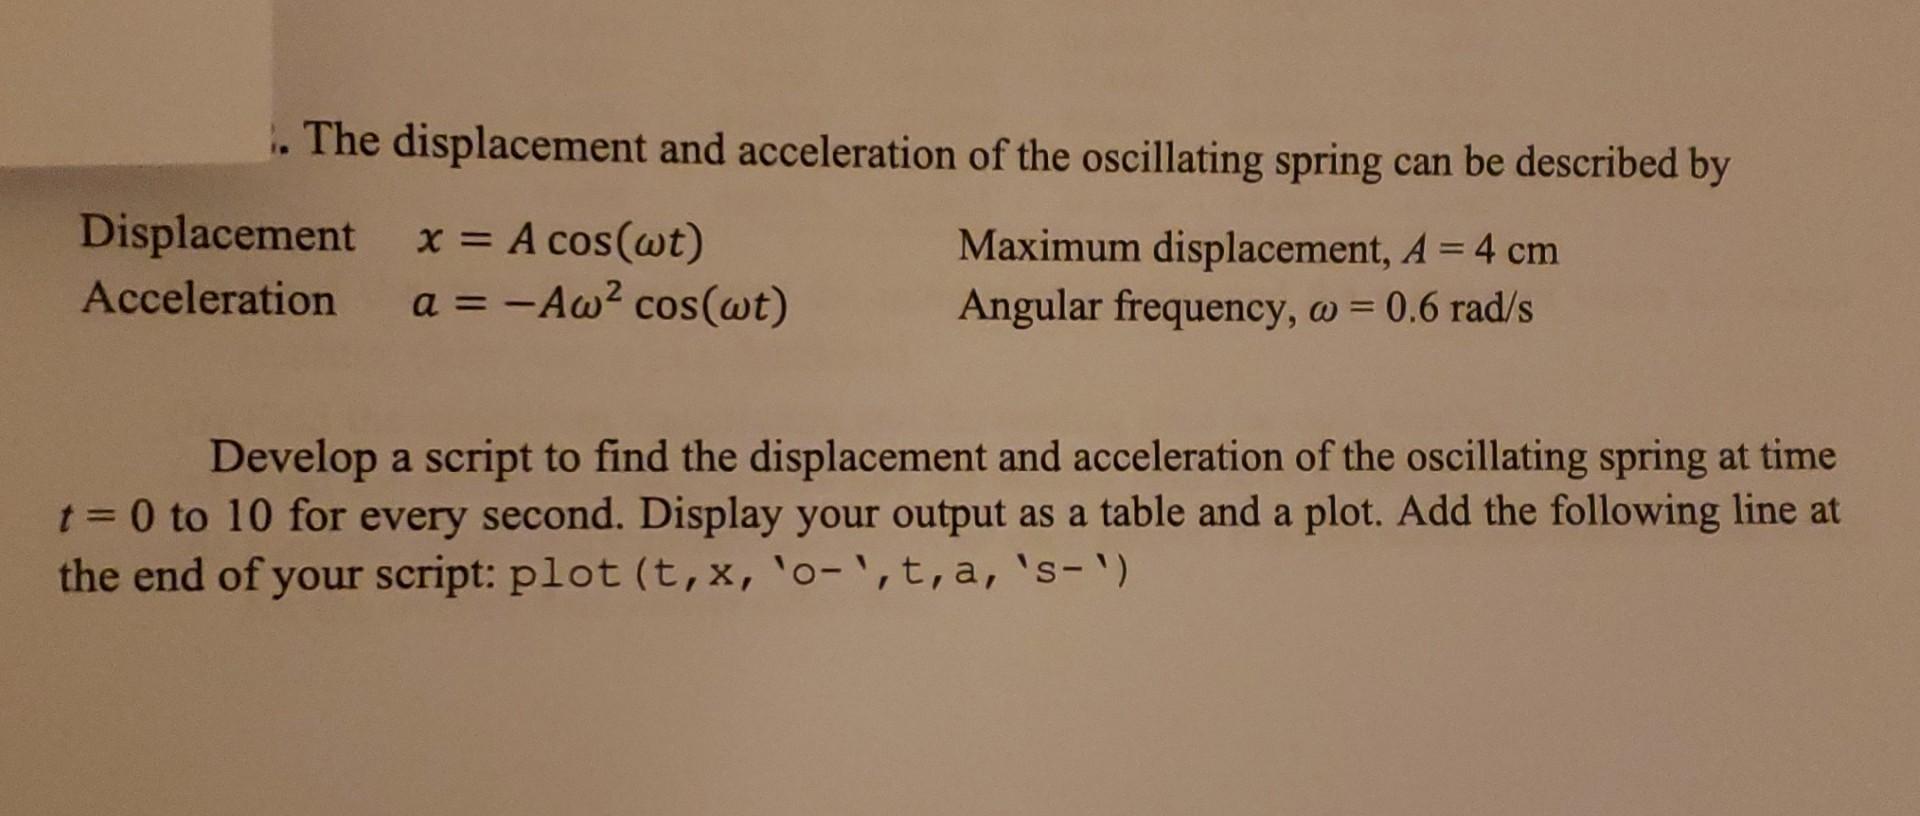
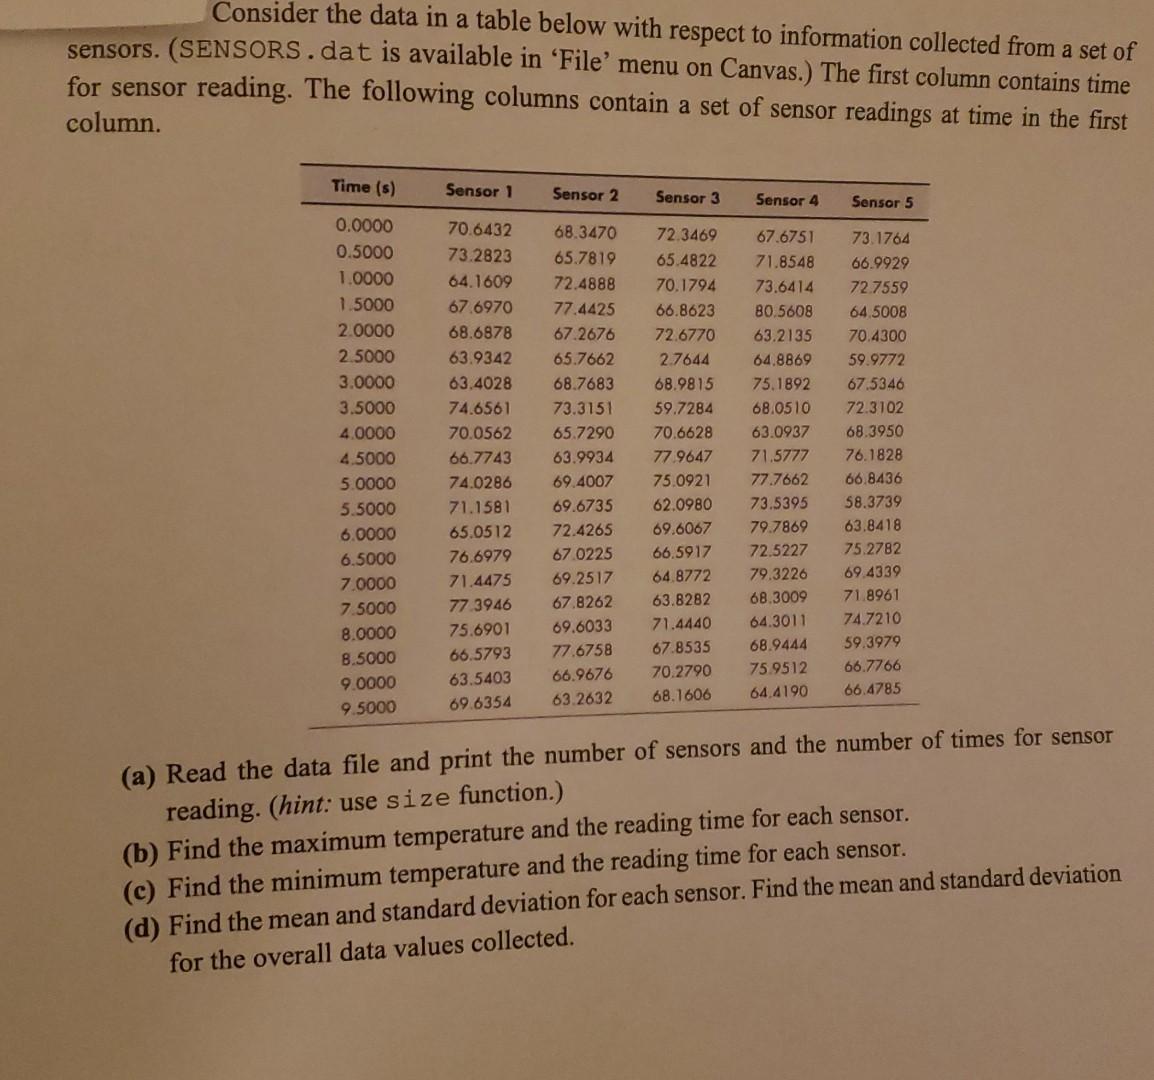
Given the data below, develop a script to calculate the temperature of water vapor (steam) using the ideal gas law and van der Waal's equation. \begin{tabular}{cl} \multicolumn{1}{c}{ Ideal Gas Law } & Pressure, P=220bar \\ PV=nRT & Moles, n=2mol \\ van der Waals & Volume, V=1L \\ (P+V2n2a)(Vnb)=nRT & a=5.536L2bar/mol2 \\ & b=0.03049L/mol \\ & Ideal gas Constant, R=0.08314472Lbar/Kmol \end{tabular} The displacement and acceleration of the oscillating spring can be described by Displacement x=Acos(t) Maximum displacement, A=4cm Acceleration a=A2cos(t) Angular frequency, =0.6rad/s Develop a script to find the displacement and acceleration of the oscillating spring at time t=0 to 10 for every second. Display your output as a table and a plot. Add the following line at the end of your script: plot(t,x,01,t,a,s1) Consider the data in a table below with respect to information collected from a set of sensors. (SENSORS . dat is available in 'File' menu on Canvas.) The first column contains time for sensor reading. The following columns contain a set of sensor readings at time in the first column. (a) Read the data file and print the number of sensors and the number of times for sensor reading. (hint: use size function.) (b) Find the maximum temperature and the reading time for each sensor. (c) Find the minimum temperature and the reading time for each sensor. (d) Find the mean and standard deviation for each sensor. Find the mean and standard deviation for the overall data values collected. Given the data below, develop a script to calculate the temperature of water vapor (steam) using the ideal gas law and van der Waal's equation. \begin{tabular}{cl} \multicolumn{1}{c}{ Ideal Gas Law } & Pressure, P=220bar \\ PV=nRT & Moles, n=2mol \\ van der Waals & Volume, V=1L \\ (P+V2n2a)(Vnb)=nRT & a=5.536L2bar/mol2 \\ & b=0.03049L/mol \\ & Ideal gas Constant, R=0.08314472Lbar/Kmol \end{tabular} The displacement and acceleration of the oscillating spring can be described by Displacement x=Acos(t) Maximum displacement, A=4cm Acceleration a=A2cos(t) Angular frequency, =0.6rad/s Develop a script to find the displacement and acceleration of the oscillating spring at time t=0 to 10 for every second. Display your output as a table and a plot. Add the following line at the end of your script: plot(t,x,01,t,a,s1) Consider the data in a table below with respect to information collected from a set of sensors. (SENSORS . dat is available in 'File' menu on Canvas.) The first column contains time for sensor reading. The following columns contain a set of sensor readings at time in the first column. (a) Read the data file and print the number of sensors and the number of times for sensor reading. (hint: use size function.) (b) Find the maximum temperature and the reading time for each sensor. (c) Find the minimum temperature and the reading time for each sensor. (d) Find the mean and standard deviation for each sensor. Find the mean and standard deviation for the overall data values collected
Step by Step Solution
There are 3 Steps involved in it

Get step-by-step solutions from verified subject matter experts