

Question: Explain and solve in detail please Example 1 By completing the table of values below, plot points to draw the graph of y = x
Explain and solve in detail please
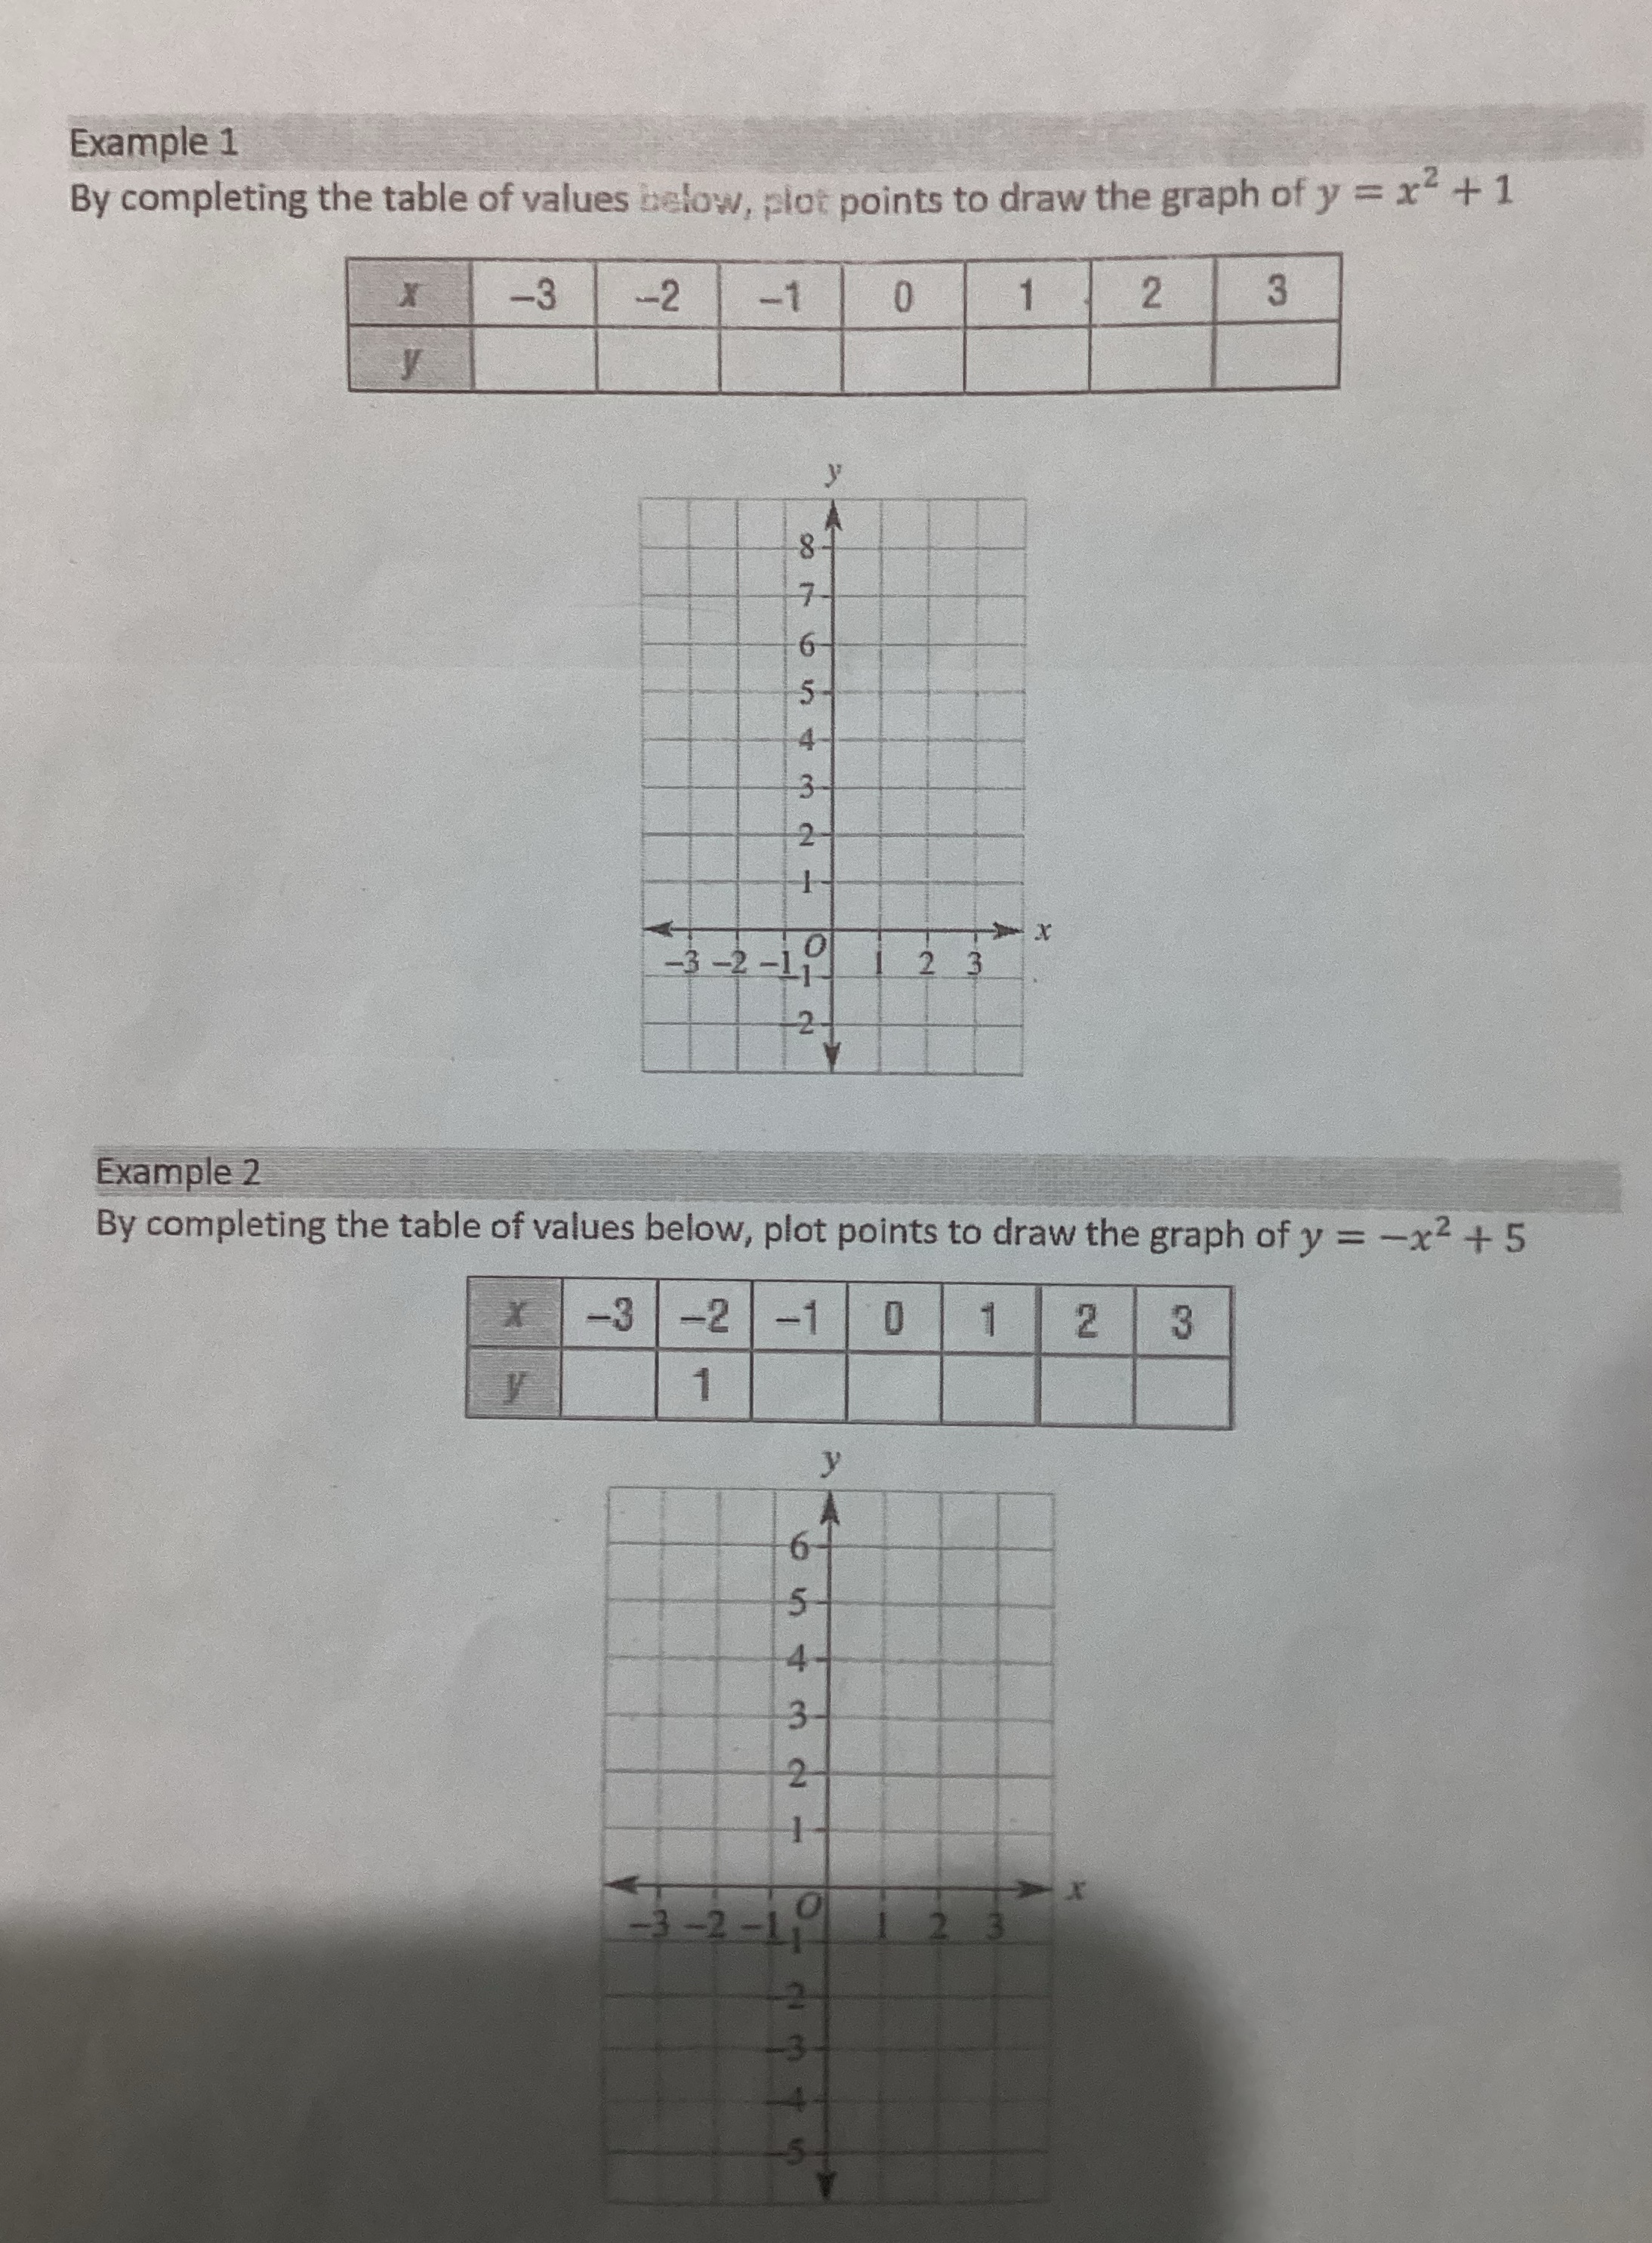
Example 1 By completing the table of values below, plot points to draw the graph of y = x + 1 -3 -2 -1 0 2 3 -3 - 2-1 2 3 Example 2 By completing the table of values below, plot points to draw the graph of y = -x2 +5 -3 -2 1 2 3 1-2 -1
Step by Step Solution
There are 3 Steps involved in it
1 Expert Approved Answer
Step: 1 Unlock

Question Has Been Solved by an Expert!
Get step-by-step solutions from verified subject matter experts
Step: 2 Unlock
Step: 3 Unlock