

Question: Explain clearly, don't copy from internet The VIX or volatility graph over time, showing how much variability there is in prices, reflecting uncertainty. The Yields
Explain clearly, don't copy from internet
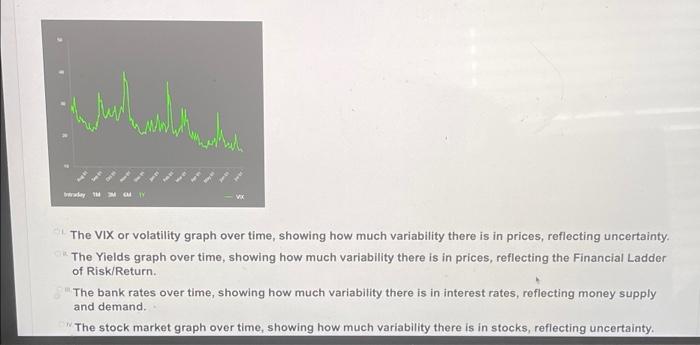
The VIX or volatility graph over time, showing how much variability there is in prices, reflecting uncertainty. The Yields graph over time, showing how much variability there is in prices, reflecting the Financial Ladder of Risk/Return. The bank rates over time, showing how much variability there is in interest rates, reflecting money supply and demand. "The stock market graph over time, showing how much variability there is in stocks, reflecting uncertainty
Step by Step Solution
There are 3 Steps involved in it
1 Expert Approved Answer
Step: 1 Unlock

Question Has Been Solved by an Expert!
Get step-by-step solutions from verified subject matter experts
Step: 2 Unlock
Step: 3 Unlock