

Question: Explain CVP graph movements on line 3, line 9, and break-even point (in terms of unit and in terms of total $ sales) by describing
Explain CVP graph movements on line 3, line 9, and break-even point (in terms of unit and in terms of total $ sales) by describing it as shifting line up (down) / having a steeper (flatter) slope / points increase (decrease) / remain unchanged / direction is uncertain. Each scenario below is independent.
- To do: Adjust your excel graph and save under each scenario. Explain in the write ups how you changed your graph in that scenario and how the graph changes from the original scenario. Use printscreen to make it evident.
- Possible terms for lines 3&9: Remain unchanged; Shift (up/down ward); Have a (steeper/flatter) slope; Shift upward and Have a (steeper/flatter) slope; Shift downward and Have a (steeper/flatter) slope
- Possible terms for breakeven point: Remain unchanged; increase, decrease, probably change but uncertain
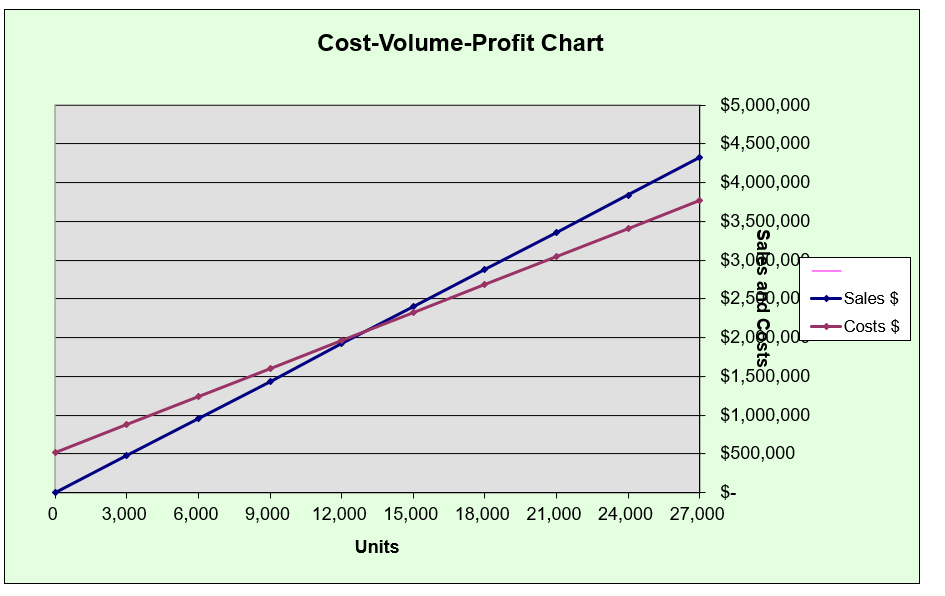
Cost-Volume-Profit Chart 0 3,000 6,000 9,000 12,000 15,000 18,000 21,000 24,000 27,000 Units $5,000,000 $4,500,000 $4,000,000 $3,500,000 2 $3,000,000 $2,500,00 -Sales $ $2,000,00 Costs $ $1,500,000 $1,000,000 $500,000
Step by Step Solution
There are 3 Steps involved in it
1 Expert Approved Answer
Step: 1 Unlock

Question Has Been Solved by an Expert!
Get step-by-step solutions from verified subject matter experts
Step: 2 Unlock
Step: 3 Unlock