

Question: EXPLAIN EVERY PART AND DO CALCULATIONS BY HAND ON PAPER. Consider the six soils whose characteristics are presented in the tables below: TABLE 1 :
EXPLAIN EVERY PART AND DO CALCULATIONS BY HAND ON PAPER. Consider the six soils whose characteristics are presented in the tables below:
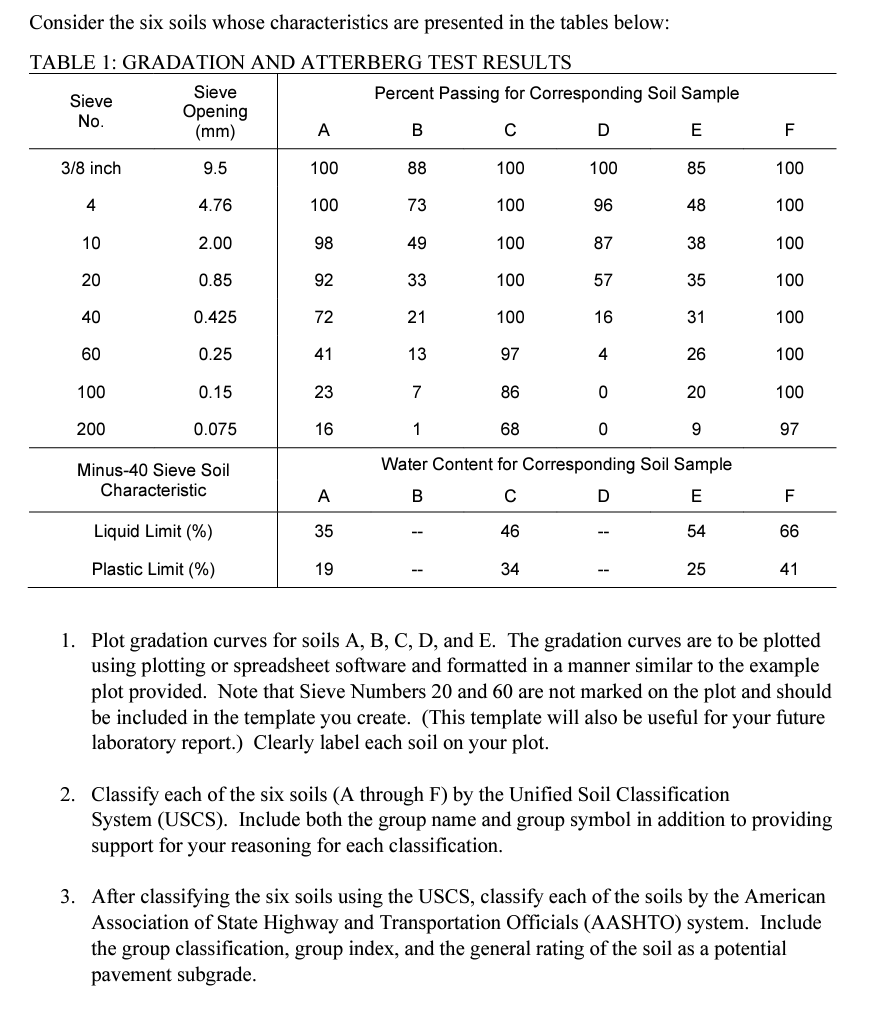
TABLE : GRADATION AND ATTERBERG TEST RESULTS
Plot gradation curves for soils A B C D and E The gradation curves are to be plotted
using plotting or spreadsheet software and formatted in a manner similar to the example
plot provided. Note that Sieve Numbers and are not marked on the plot and should
be included in the template you create. This template will also be useful for your future
laboratory report. Clearly label each soil on your plot.
Classify each of the six soils A through F by the Unified Soil Classification
System USCS Include both the group name and group symbol in addition to providing
support for your reasoning for each classification.
After classifying the six soils using the USCS, classify each of the soils by the American
Association of State Highway and Transportation Officials AASHTO system. Include
the group classification, group index, and the general rating of the soil as a potential
pavement subgrade.
Step by Step Solution
There are 3 Steps involved in it
1 Expert Approved Answer
Step: 1 Unlock

Question Has Been Solved by an Expert!
Get step-by-step solutions from verified subject matter experts
Step: 2 Unlock
Step: 3 Unlock