

Question: Explain for each point How well does a model producing following points on the given ROC graph perform? 1) Point C 2) Point E 1.0
Explain for each point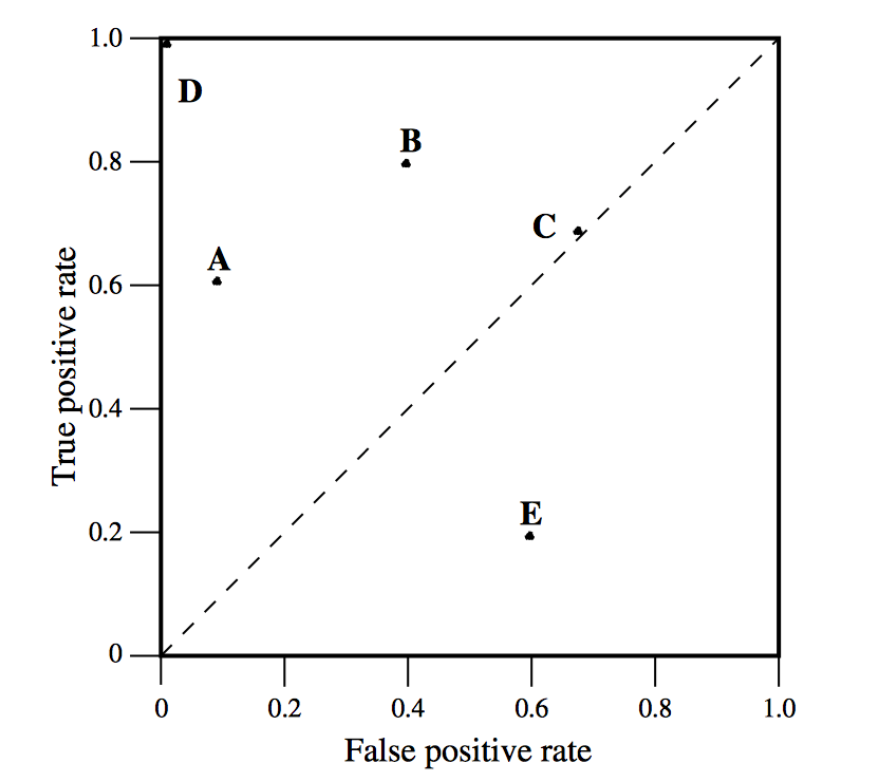
How well does a model producing following points on the given ROC graph perform?
1) Point C
2) Point E
1.0 D B 0.8 C, A 0.6 True positive rate 0.4 E 0.2 0 0 0.2 0.8 1.0 0.4 0.6 False positive rate 1.0 D B 0.8 C, A 0.6 True positive rate 0.4 E 0.2 0 0 0.2 0.8 1.0 0.4 0.6 False positive rateStep by Step Solution
There are 3 Steps involved in it
1 Expert Approved Answer
Step: 1 Unlock

Question Has Been Solved by an Expert!
Get step-by-step solutions from verified subject matter experts
Step: 2 Unlock
Step: 3 Unlock