

Can you please help me with this question? Explain health care spending in each region of the
Question:
Can you please help me with this question?
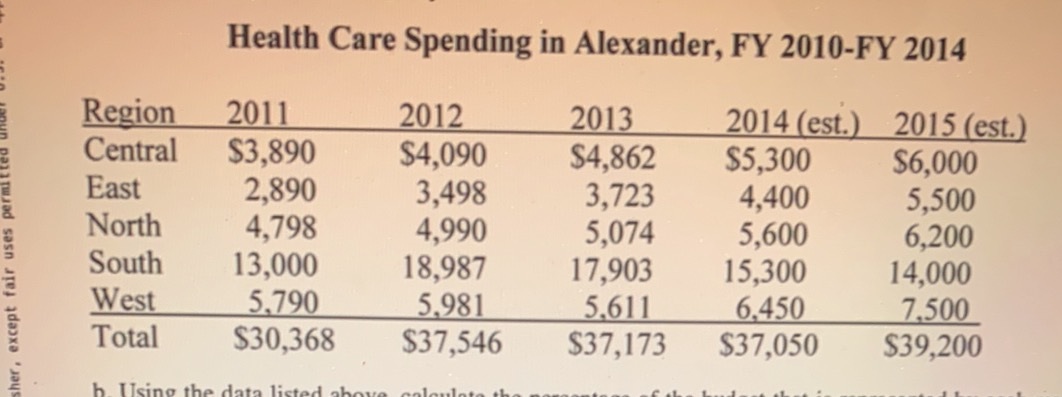
Explain health care spending in each region of the state in 2013
a. Using the data listed below (in millions), calculate the percentage change for average HCS spending in each region from year to year. Describe the findings using only percentages (round the percentages to one digit to the right of the decimal) in your table.
b. Using the data listed above, calculate the percentage of the budget that is represented by each revenue source for each fiscal year. Each fiscal year should total 100%.
c. Using the HCS percentage change data that you calculated in 5a, create line graphs describing the growth or decline in spending by region. Note: The various regions should appear in the legend, not the year. All of these graphs should be completed in one step.
d. Using the original raw data for the City of Alexander Health Care Spending allocations described above, create line graphs describing the growth or decline in spending by region. All of the regional line graphs should be completed in one step (one graph with five lines). Also, format the data labels so that the dollar amount for each year and region appears on the graph. Note: The various regions should appear in the legend, not the year.
Expert Answer:
Answer a percentage change for average HCS spending in each region from year to year 2012 2013 2... View the full answer


Statistics for Managers Using Microsoft Excel
ISBN: 978-0133130805
7th edition
Authors: David M. Levine, David F. Stephan, Kathryn A. Szabat
