

Question: Explain how Figure 6 illustrates three things that affect the power of a statistical test. J Physiol 590.21 Statistical perspectives A 2 populations, different sample
Explain how Figure 6 illustrates three things that affect the power of a statistical test.
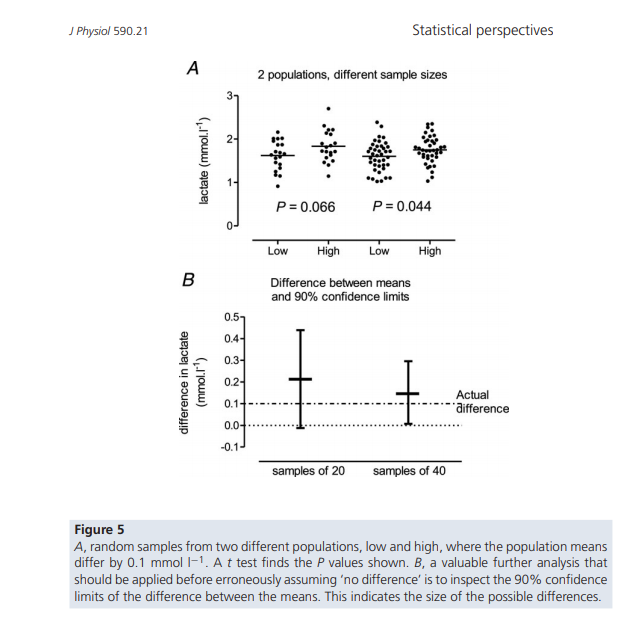
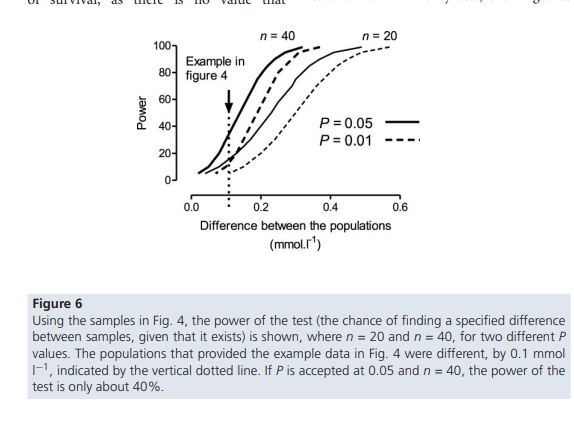
J Physiol 590.21 Statistical perspectives A 2 populations, different sample sizes 3 2- lactate (mmol.I~]) 1- P = 0.066 P = 0.044 Low High Low High B Difference between means and 90% confidence limits 0.57 0.4- 0.3- (mmol.(1) difference in lactate 0.2- Actual 0.0- . ........= -0.1- samples of 20 samples of 40 Figure 5 A, random samples from two different populations, low and high, where the population means differ by 0.1 mmol I-1. A t test finds the P values shown. B, a valuable further analysis that should be applied before erroneously assuming 'no difference' is to inspect the 90% confidence limits of the difference between the means. This indicates the size of the possible differences.n = 40 n = 20 100- Example in 80 figure 4 60- Power 40- P = 0.05 P = 0.01 -- - 20- 0.0 0.2 0.4 0.6 Difference between the populations (mmol.) Figure 6 Using the samples in Fig. 4, the power of the test (the chance of finding a specified difference between samples, given that it exists) is shown, where n = 20 and n = 40, for two different P values. The populations that provided the example data in Fig. 4 were different, by 0.1 mmol I-1, indicated by the vertical dotted line. If Pis accepted at 0.05 and n = 40, the power of the test is only about 40%
Step by Step Solution
There are 3 Steps involved in it

Get step-by-step solutions from verified subject matter experts