

Question: Explain how these statistics describe your data ( how many cars per household) and what they suggest about the sample. No. of Cars 5+ 4-
Explain how these statistics describe your data ( how many cars per household) and what they suggest about the sample.
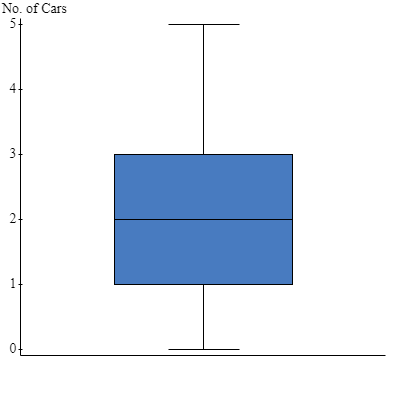
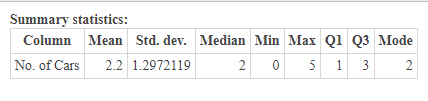
No. of Cars 5+ 4- 1-Summary statistics: Column Mean Std. dev. Median Min Max Q1 03 Mode No. of Cars 2.2 1.2972119 2 1 3 2
Step by Step Solution
There are 3 Steps involved in it
1 Expert Approved Answer
Step: 1 Unlock

Question Has Been Solved by an Expert!
Get step-by-step solutions from verified subject matter experts
Step: 2 Unlock
Step: 3 Unlock