

Question: Explain how to replicate table 9.1 in an Excel spreadsheet TABLE 9.1 Discounted Cash Flow Valuation of Hasbro Inc. on December 31, 2016 ($ millions
Explain how to replicate table 9.1 in an Excel spreadsheet
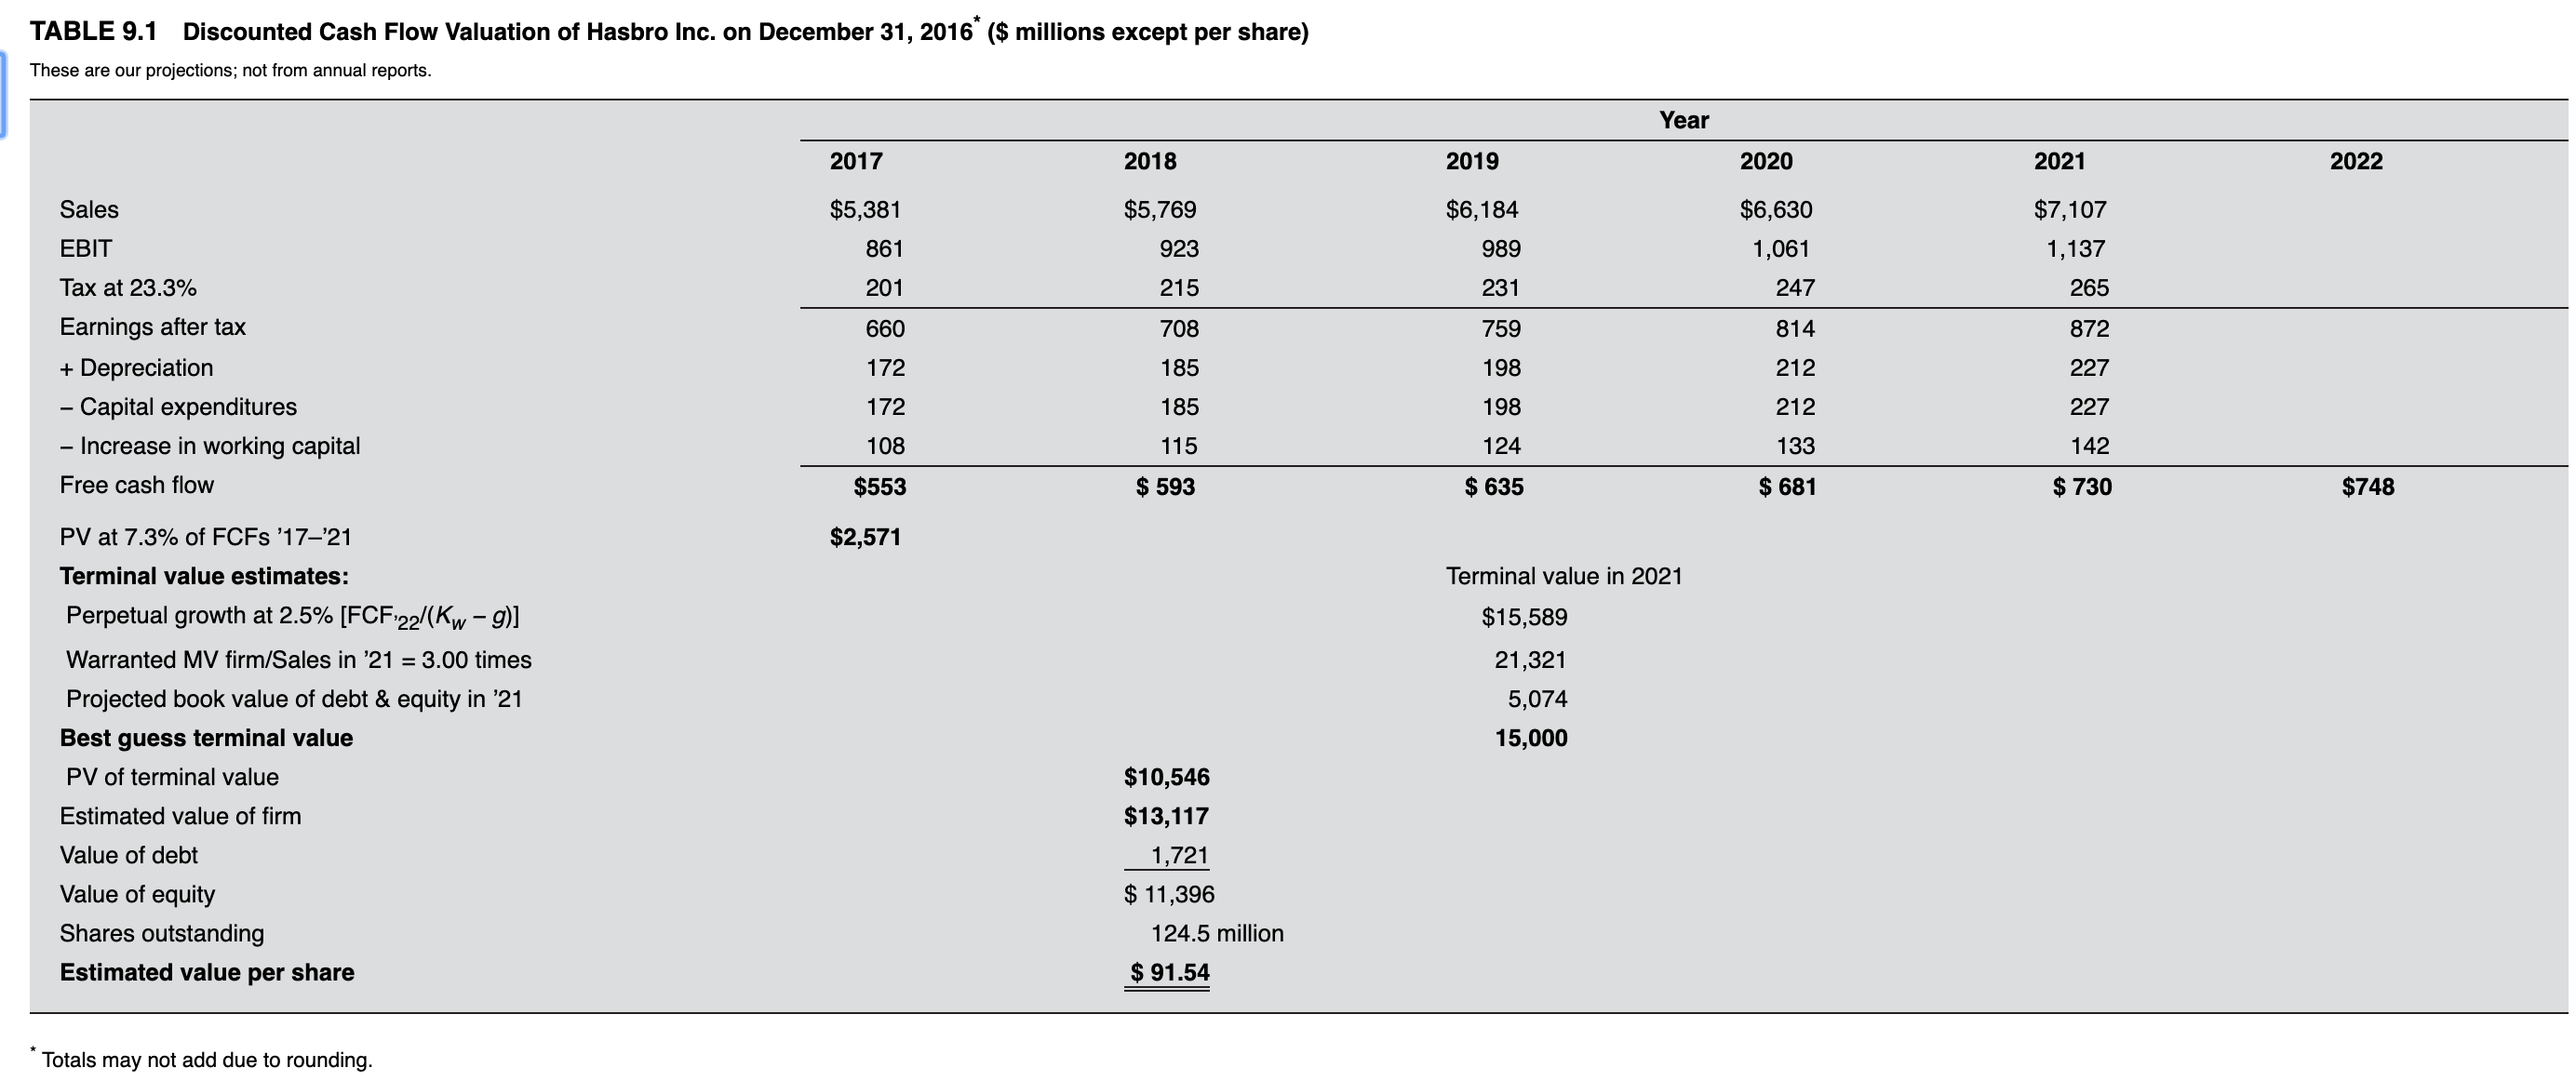
TABLE 9.1 Discounted Cash Flow Valuation of Hasbro Inc. on December 31, 2016 ($ millions except per share) These are our projections; not from annual reports. Year 2017 2018 2019 2020 2021 2022 Sales $5,381 $5,769 $6, 184 $6,630 $7, 107 EBIT 861 923 989 1,061 1 , 137 Tax at 23.3% 201 215 231 247 265 Earnings after tax 660 708 759 814 372 + Depreciation 172 185 198 212 227 - Capital expenditures 172 185 198 212 227 - Increase in working capital 108 115 124 133 142 Free cash flow $553 $ 593 $ 635 $ 681 $ 730 $748 PV at 7.3% of FCFs '17-'21 $2,571 Terminal value estimates: Terminal value in 2021 Perpetual growth at 2.5% [FCF.22/(Kw - 9)] $15,589 Warranted MV firm/Sales in '21 = 3.00 times 21,321 Projected book value of debt & equity in '21 5,074 Best guess terminal value 15,000 PV of terminal value $10,546 Estimated value of firm $13, 117 Value of debt 1,721 Value of equity $ 11,396 Shares outstanding 124.5 million Estimated value per share $ 91.54 Totals may not add due to rounding
Step by Step Solution
There are 3 Steps involved in it

Get step-by-step solutions from verified subject matter experts