

Question: Explain in detail what these graph shows - evaluate - critically assess f20:22 Search Trend Analysis for GDP per Capita, usd Method Model type Linear
Explain in detail what these graph shows
- evaluate
- critically assess
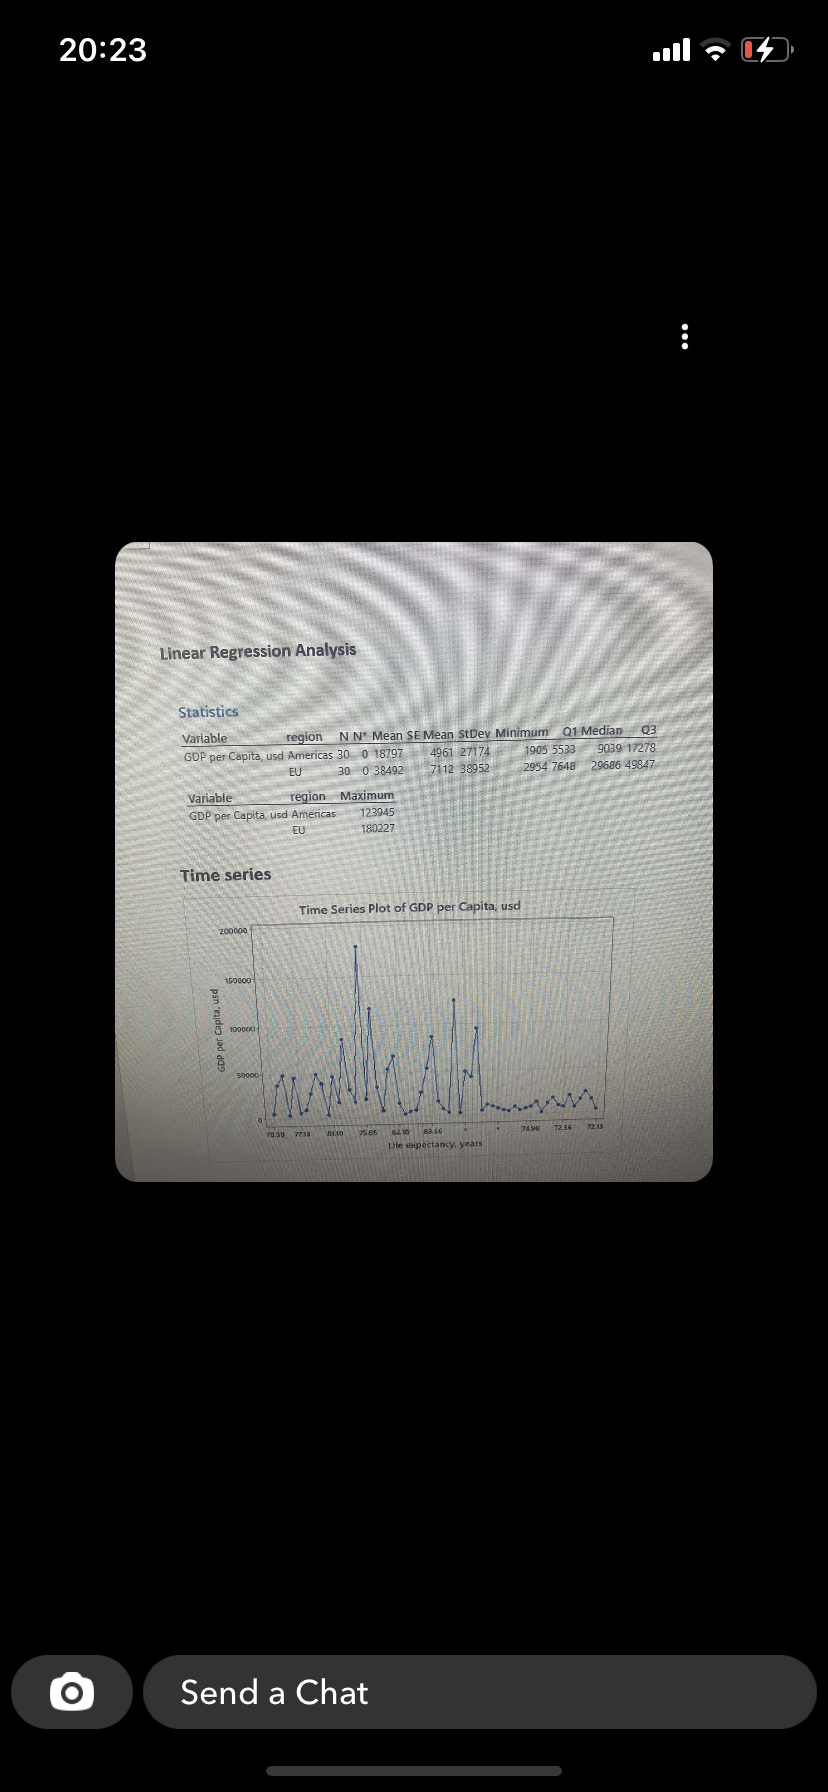
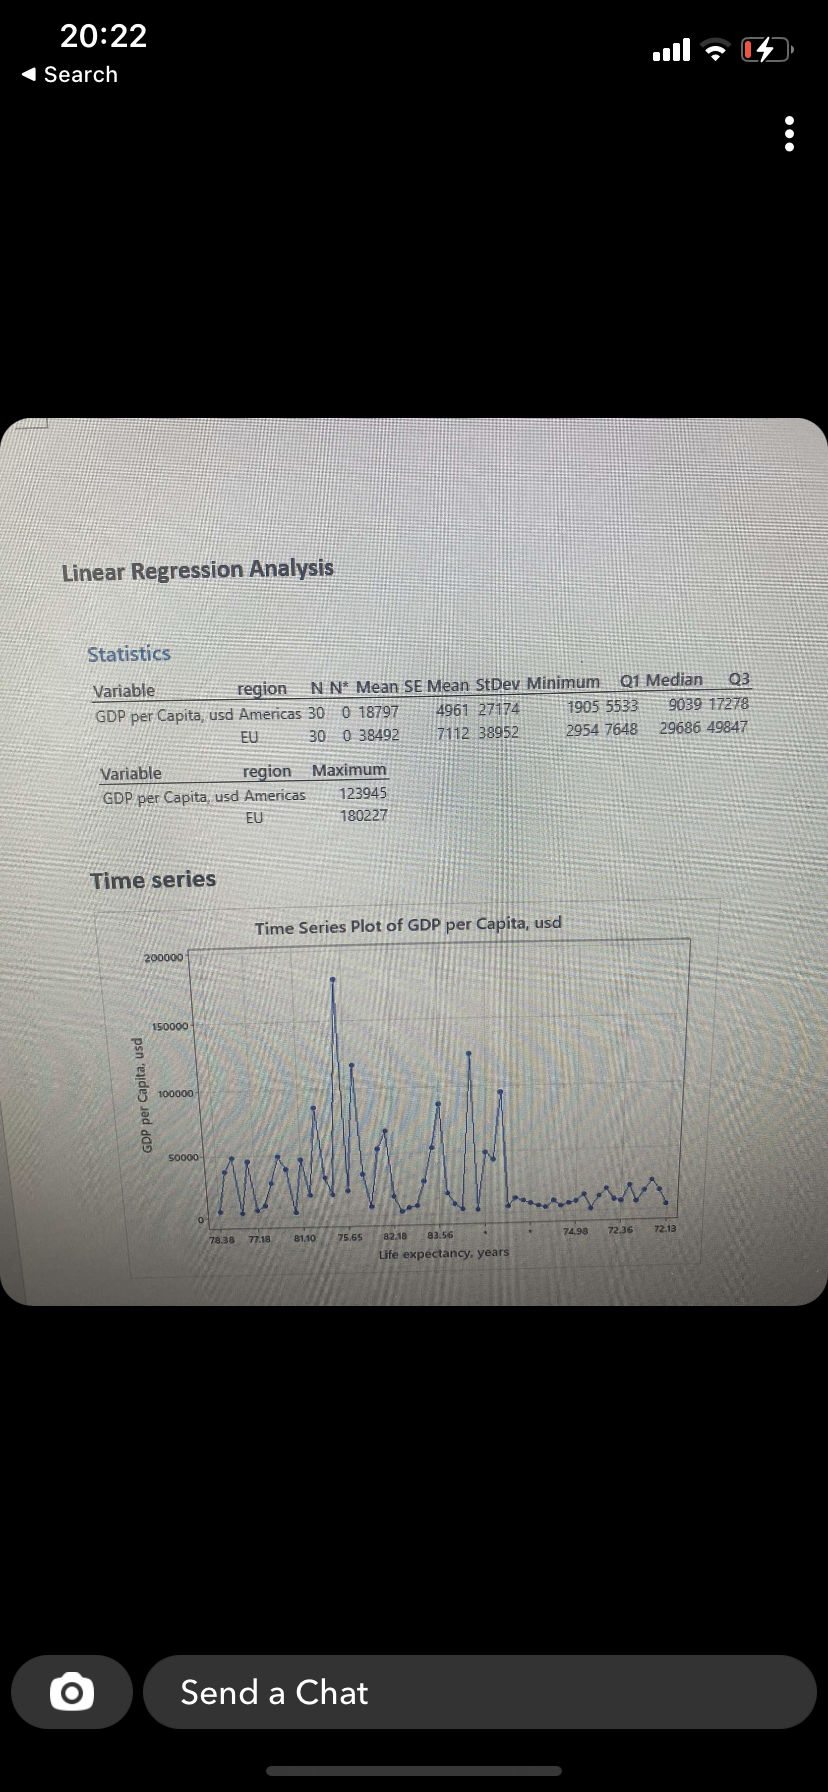
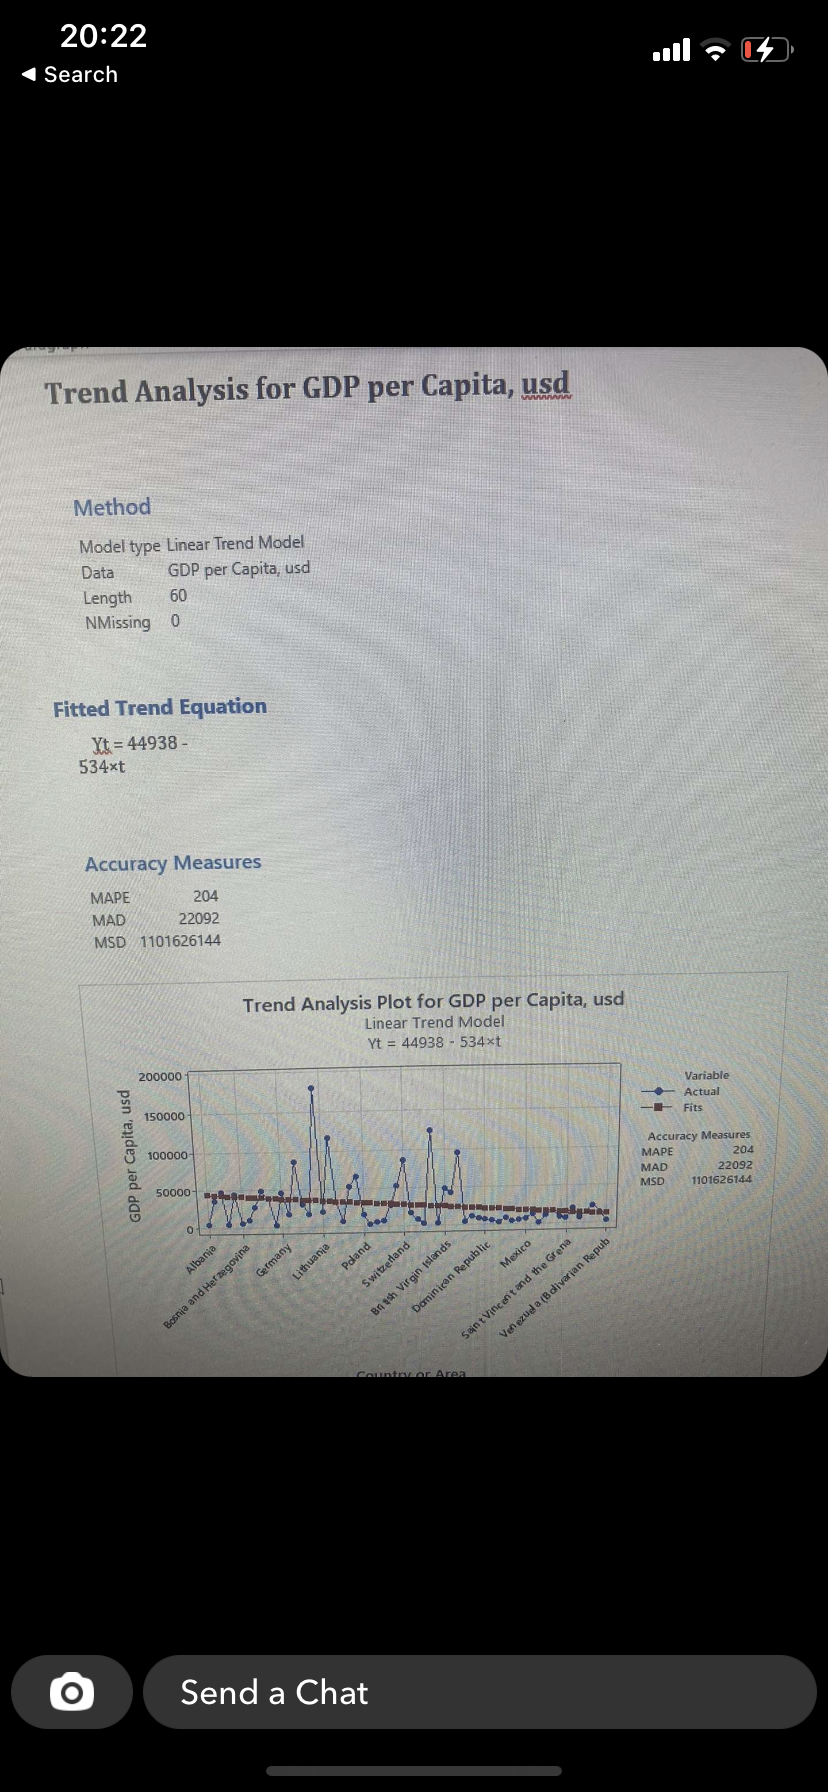
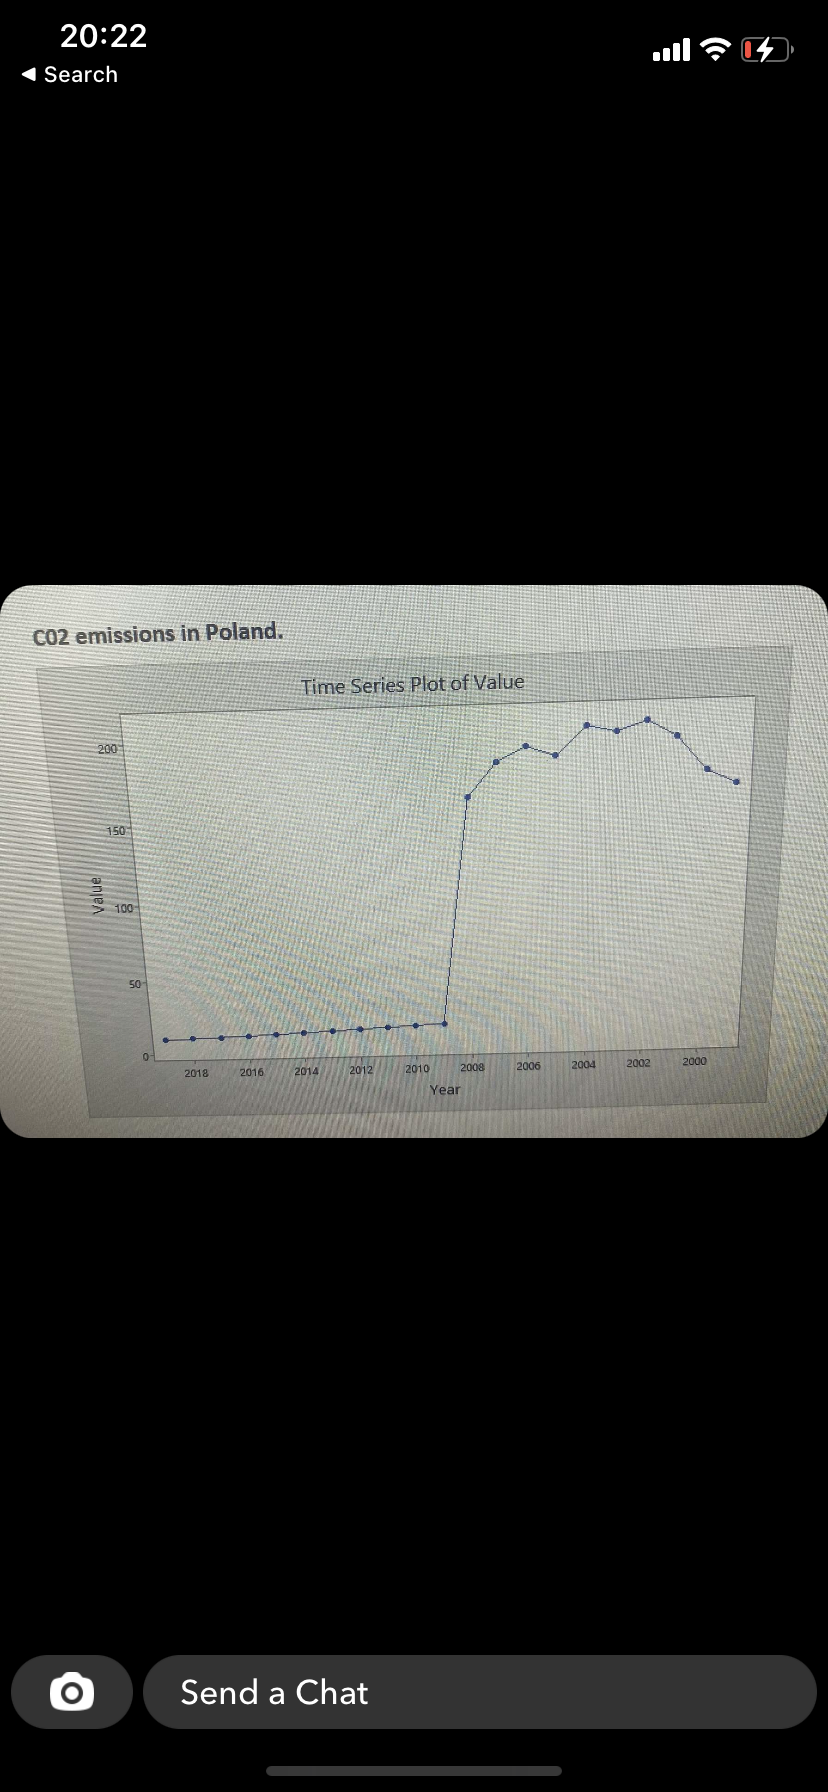
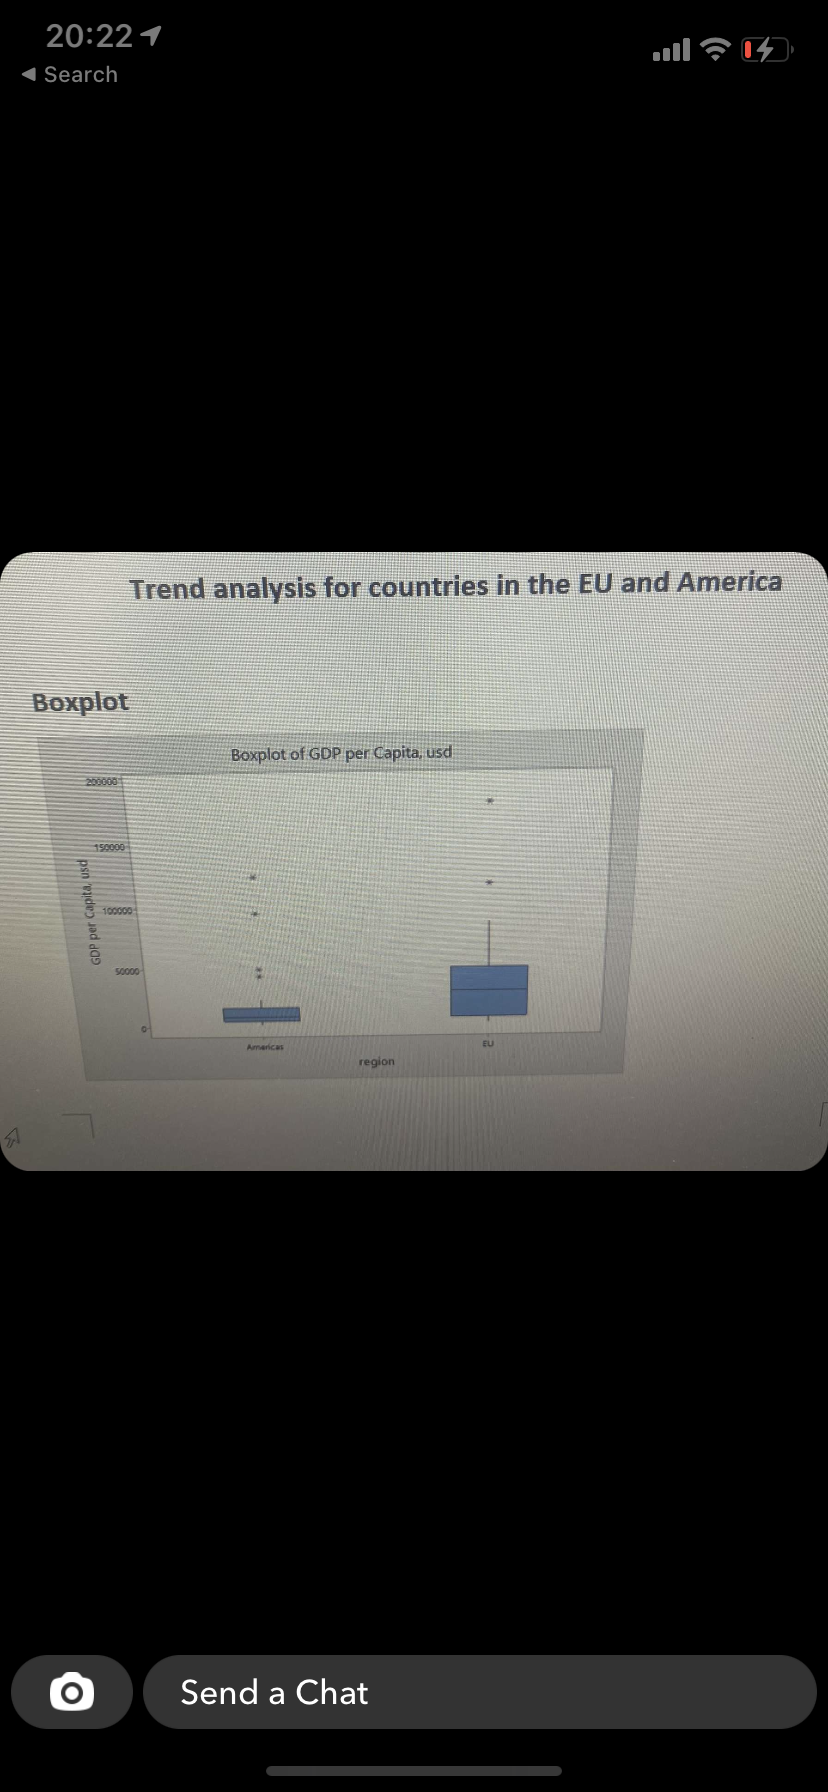
\f20:22 Search Trend Analysis for GDP per Capita, usd Method Model type Linear Trend Model Data GDP per Capita, usd Length 60 NMissing 0 Fitted Trend Equation Yt = 44938 - 534xt Accuracy Measures MAPE 204 MAD 22092 MSD 1101626144 Trend Analysis Plot for GDP per Capita, usd Linear Trend Model Yt = 44938 - 534xt 200000 Variable Actual 150000 Fits GDP per Capita, usd 100000 Accuracy Measures MAPE 204 MAD 22092 50000- MSD 1101626144 of Albania Germany Lithuania poland Mexico Switzerland Bosnia and Herzegovina Dominican Republic Bnash Virgin Islands Venezuela (Bolivarian Repub Saint Vincent and the Grena O Send a Chat20:22 Search CO2 emissions in Poland. Time Series Plot of Value 200 150 Value 100 50 2004 2002 2000 2018 2016 2014 2012 2010 2008 2006 Year O Send a Chat
Step by Step Solution
There are 3 Steps involved in it

Get step-by-step solutions from verified subject matter experts