

Question: explain. step by step in excel Binomial short-term interest-rate model with the true probability measure a. We observe the following spot rate curve. Assume semiannual
 explain. step by step in excel
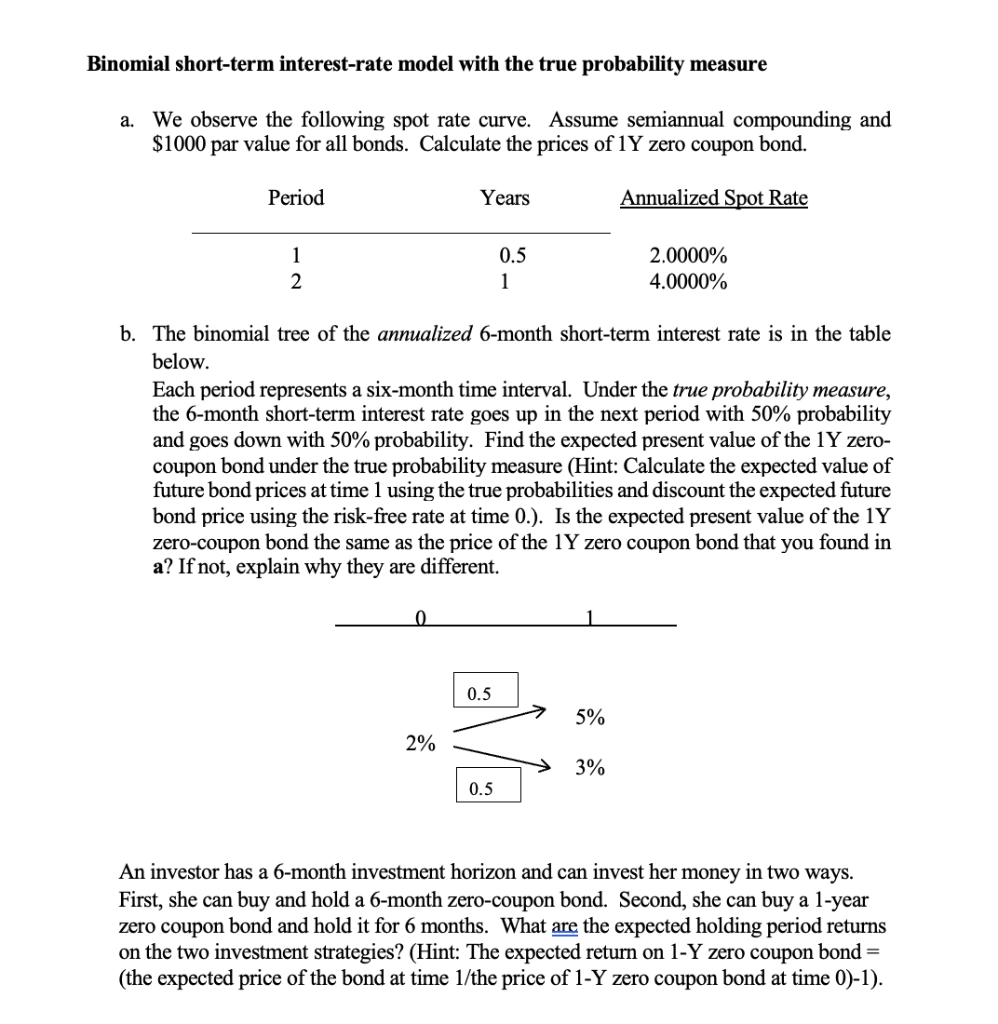
Binomial short-term interest-rate model with the true probability measure a. We observe the following spot rate curve. Assume semiannual compounding and $1000 par value for all bonds. Calculate the prices of 1Y zero coupon bond. Period Years Annualized Spot Rate 1 2 0.5 1 2.0000% 4.0000% b. The binomial tree of the annualized 6-month short-term interest rate is in the table below. Each period represents a six-month time interval. Under the true probability measure, the 6-month short-term interest rate goes up in the next period with 50% probability and goes down with 50% probability. Find the expected present value of the 1Y zero- coupon bond under the true probability measure (Hint: Calculate the expected value of future bond prices at time 1 using the true probabilities and discount the expected future bond price using the risk-free rate at time 0.). Is the expected present value of the 1Y zero-coupon bond the same as the price of the 1Y zero coupon bond that you found in a? If not, explain why they are different. 0 0.5 5% 2% 3% 0.5 An investor has a 6-month investment horizon and can invest her money in two ways. First, she can buy and hold a 6-month zero-coupon bond. Second, she can buy a 1-year zero coupon bond and hold it for 6 months. What are the expected holding period returns on the two investment strategies? (Hint: The expected return on 1-Y zero coupon bond = (the expected price of the bond at time 1/the price of 1-Y zero coupon bond at time 0)-1)
Step by Step Solution
There are 3 Steps involved in it

Get step-by-step solutions from verified subject matter experts