

Question: Explain the deadlock situation in the resource-allocation graph shown in Figure 1. Here, T1, T2, and T3 are threads - presented by circles; R1,
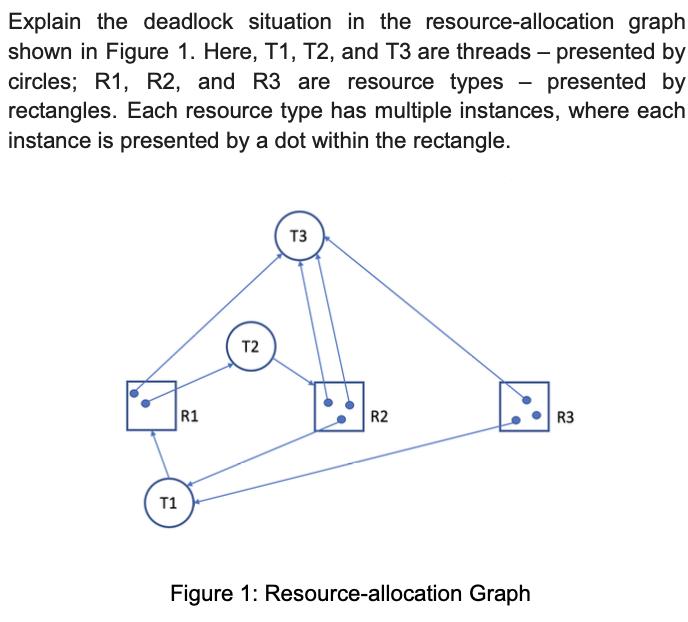
Explain the deadlock situation in the resource-allocation graph shown in Figure 1. Here, T1, T2, and T3 are threads - presented by circles; R1, R2, and R3 are resource types presented by rectangles. Each resource type has multiple instances, where each instance is presented by a dot within the rectangle. T1 R1 T2 T3 R2 Figure 1: Resource-allocation Graph R3
Step by Step Solution
There are 3 Steps involved in it
1 Expert Approved Answer
Step: 1 Unlock

In the given resourceallocation graph a deadlock situation occurs when all three threads T1 T2 and T... View full answer
Question Has Been Solved by an Expert!
Get step-by-step solutions from verified subject matter experts
Step: 2 Unlock
Step: 3 Unlock