Explain the difference between a blue collar job and white collar job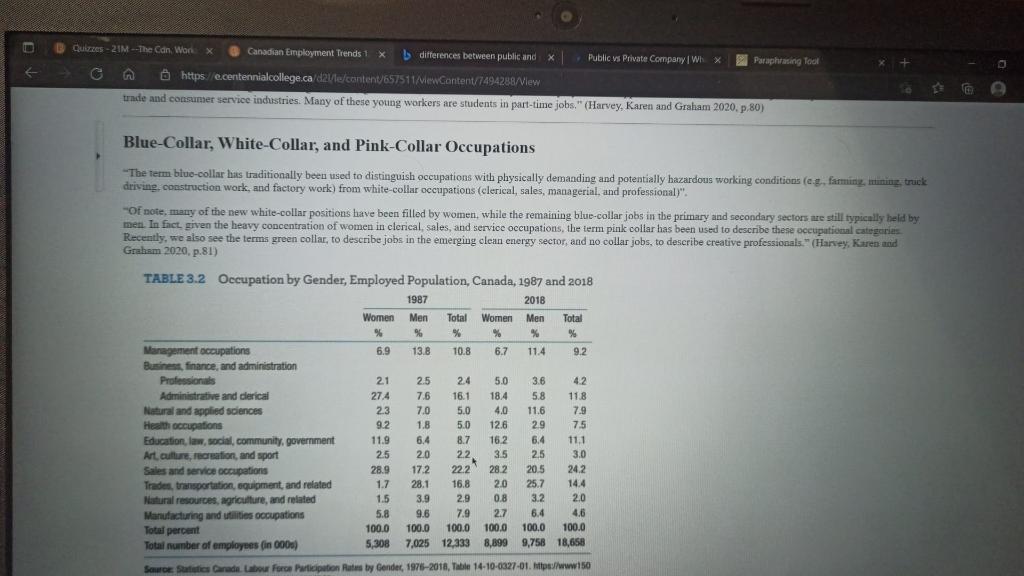
Ques-21M --The Cdr Wore X Canadian Employment Trends 1 x differences between public and X Public vs Private Company. W X Paraphrasing Tool https://e.centennialcollege.ca/d21e/content/657511/lewContent/7494288/View trade and consumer service industries. Many of these young workers are students in part-time jobs." (Harvey, Karen and Graham 2020, p.80) Blue-Collar, White-Collar, and Pink-Collar Occupations "The term blue-collar has traditionally been used to distinguish occupations with physically demanding and potentially hazardous working conditions (eg, farming, mining, truck driving, construction work, and factory work) from white-collar occupations (clerical, sales, managerial and professional)". "Of note, many of the new white collar positions have been filled by women, while the remaining blue-collar jobs in the primary and secondary sectors are still typically held by men. In fact, given the heavy concentration of women in clerical, sales, and service occupations, the term pink collar has been used to describe these occupational categories Recently, we also see the terms green collar, to describe jobs in the emerging clean energy sector, and no collar jobs, to describe creative professionals." (Harvey, Karen and Graham 2020, p.81) TABLE 3.2 Occupation by Gender, Employed Population, Canada, 1987 and 2018 1987 2018 Women Men Total Women Men Total % 96 % % % % Management occupations 6.9 13.8 10.8 6.7 11.4 9.2 Business, finance, and administration Professionals 21 2.5 24 5.0 36 42 Administrative and clerical 27.4 76 16.1 18.4 5.8 11.8 Natural and applied Sciences 23 7.0 5.0 4.0 11.6 7.9 Health occupations 9.2 1.8 5.0 12.6 29 7.5 Education, law, social, community, government 11.9 6.4 8.7 16.2 6.4 11.1 Art. culture, recreation, and sport 25 20 2.2 3.5 2.5 3.0 Sales and service occupations 28.9 17.2 22.2 282 20.5 24.2 Trades, transportation, equipment, and related 1.7 28.1 16.8 20 25.7 14.4 Natural resources, agriculture, and related 1.5 3.9 2.9 0.8 3.2 2.0 Manufacturing and utilities occupations 5.8 9.6 7.9 27 6.4 4.6 Total percent 100.0 100.0 100.0 100.0 100.0 100.0 Total number of employees (in 000) 5308 7,025 12,333 8,899 9,758 18,658 Sare Stics Canade Labour Force Participation Rates by Gender, 1971-2018, Table 14-10-0327-01 ://www150


