

Question: Explain the following graphs from Python False True Revenue False True Revenue T rer T Mnn va Panelaliec urt Rev. Mnn ve RonreRatoc wrt Rev.
Explain the following graphs from Python
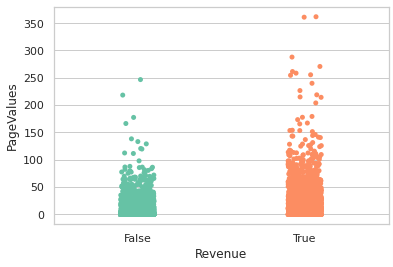
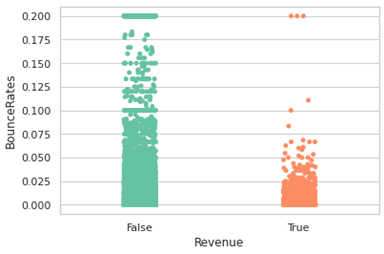
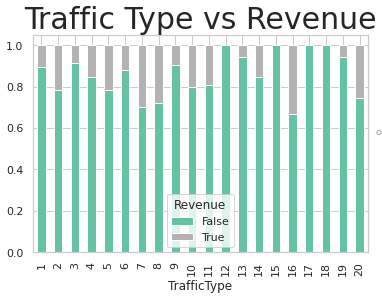
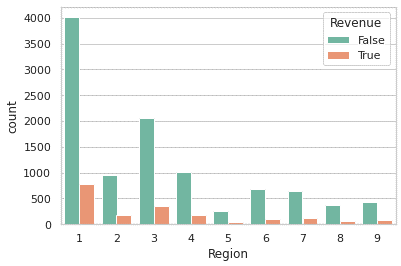
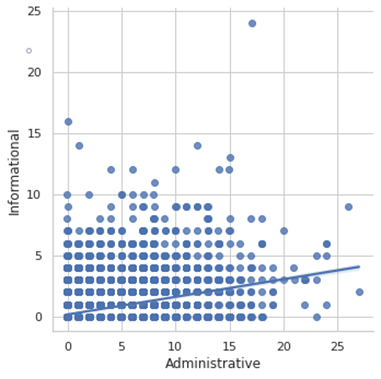
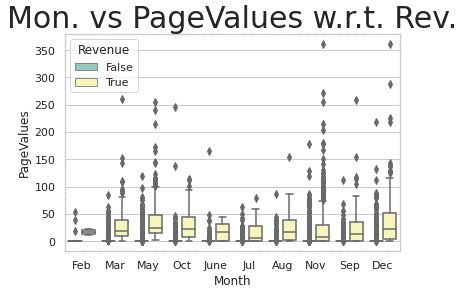
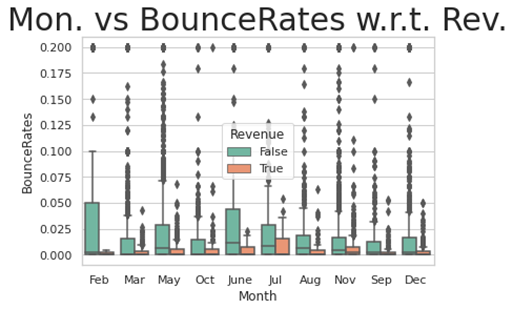
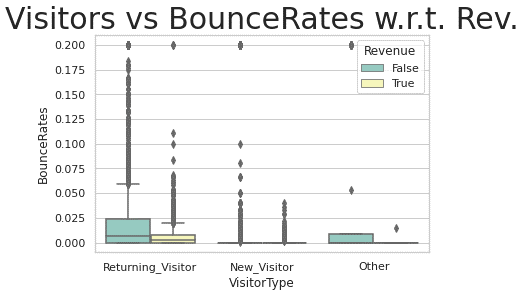
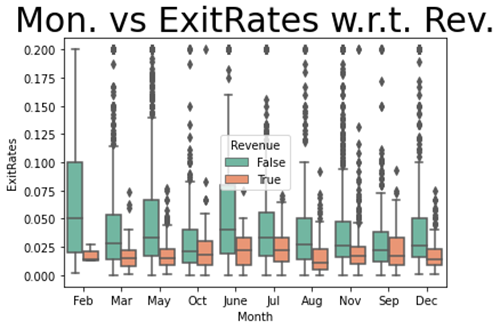
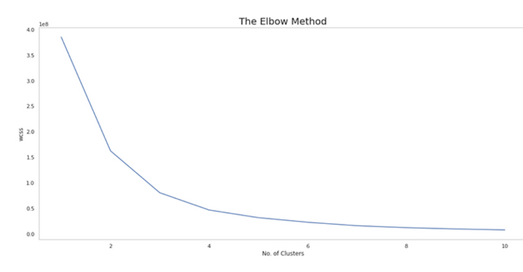
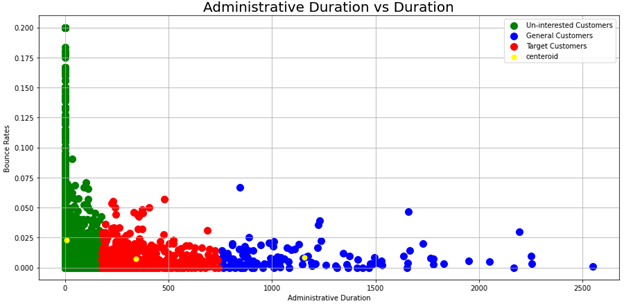
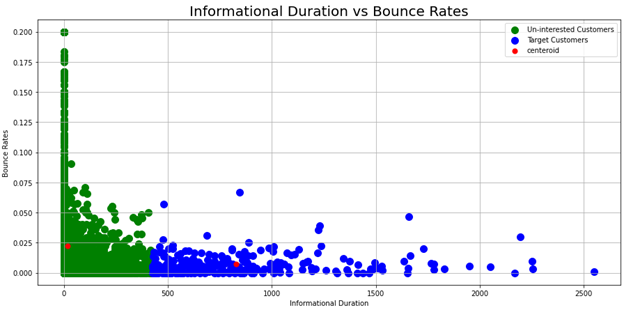
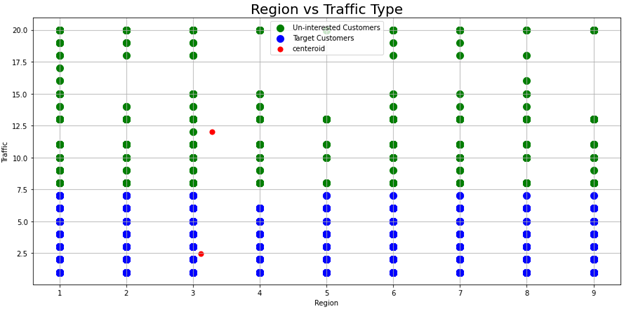
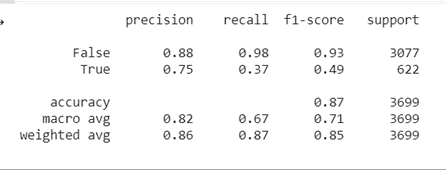
False True Revenue False True Revenue T rer T Mnn va Panelaliec urt Rev. Mnn ve RonreRatoc wrt Rev. Vicitnre we RnunreRatec in rt Rev. Mnn we CwitDatar unrt Dow. The Elbow Method Administrative Duration vs Duration Informational Duration vs Bounce Rates \begin{tabular}{rrrrr} & precision & recall & f1-score & support \\ False & 0.88 & 0.98 & 0.93 & 3077 \\ True & 0.75 & 0.37 & 0.49 & 622 \\ accuracy & & & & \\ macro avg & 0.82 & 0.67 & 0.87 & 3699 \\ weighted avg & 0.86 & 0.87 & 0.85 & 3699 \\ \hline \end{tabular}
Step by Step Solution
There are 3 Steps involved in it
1 Expert Approved Answer
Step: 1 Unlock

Question Has Been Solved by an Expert!
Get step-by-step solutions from verified subject matter experts
Step: 2 Unlock
Step: 3 Unlock