

Question: Explain the graph below please. Net interest income, yield curve slope and short-term rate change United States Japan 4 2 0 0 -2. -2 Net
Explain the graph below please.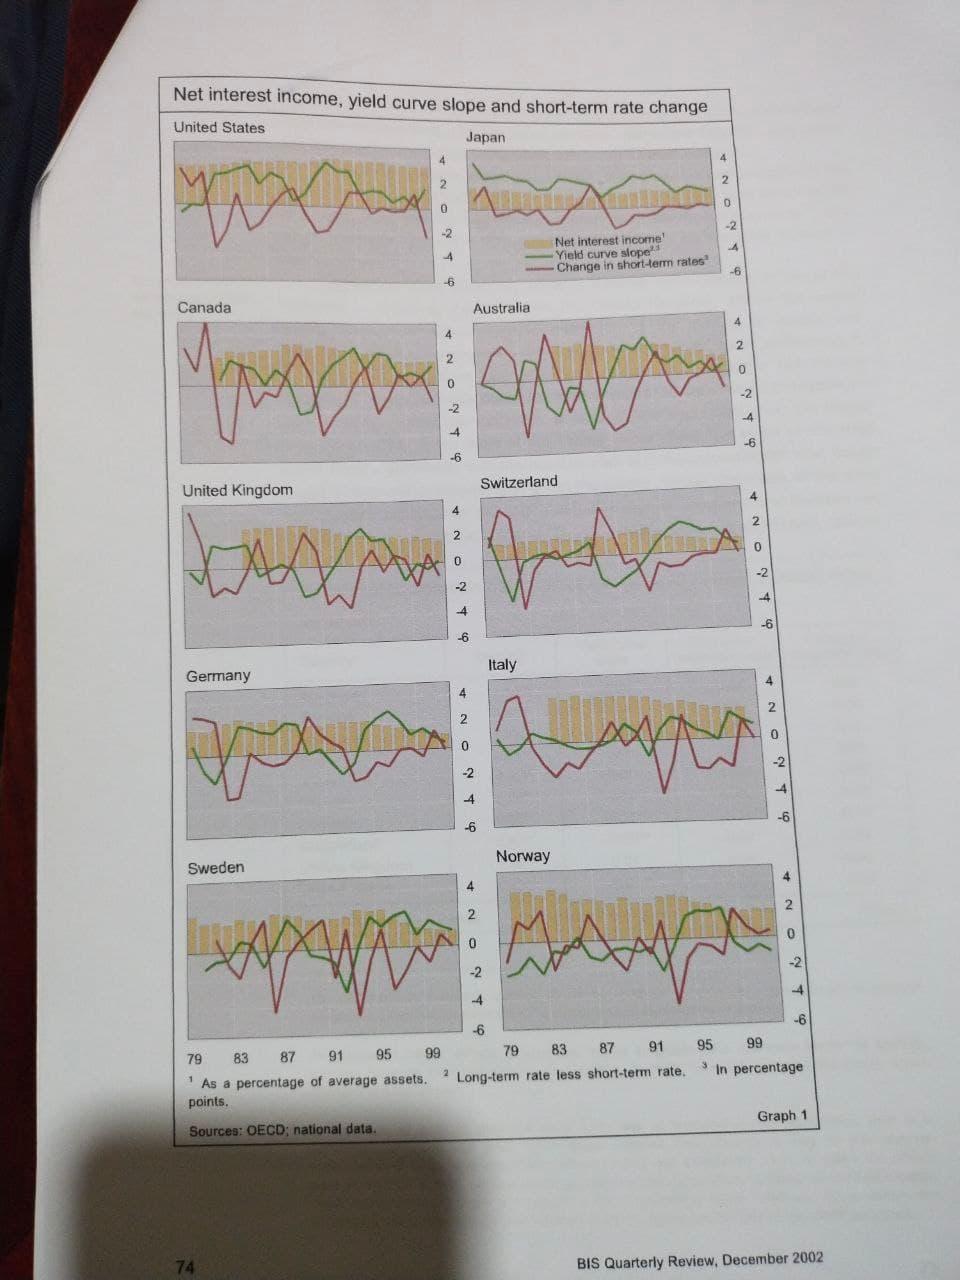
Net interest income, yield curve slope and short-term rate change United States Japan 4 2 0 0 -2. -2 Net interest income Yield curve slope Change in short-term rates! -6 -6 Canada Australia 4 2 0 0 -2 4 -6 -6 Switzerland United Kingdom 4 4 2 2 0 tid 0 V -2 4 -6 -6 Italy Germany 4 4 2 0 NON -2 4 -6 -6 Norway Sweden LAN 0 + NYT -6 -6 79 83 87 91 95 99 79 83 87 91 95 99 As a percentage of average assets. ? Long-term rate less short-term rate. In percentage points. Graph 1 Sources: OECD: national data 74 BIS Quarterly Review, December 2002 Net interest income, yield curve slope and short-term rate change United States Japan 4 2 0 0 -2. -2 Net interest income Yield curve slope Change in short-term rates! -6 -6 Canada Australia 4 2 0 0 -2 4 -6 -6 Switzerland United Kingdom 4 4 2 2 0 tid 0 V -2 4 -6 -6 Italy Germany 4 4 2 0 NON -2 4 -6 -6 Norway Sweden LAN 0 + NYT -6 -6 79 83 87 91 95 99 79 83 87 91 95 99 As a percentage of average assets. ? Long-term rate less short-term rate. In percentage points. Graph 1 Sources: OECD: national data 74 BIS Quarterly Review, December 2002
Step by Step Solution
There are 3 Steps involved in it

Get step-by-step solutions from verified subject matter experts