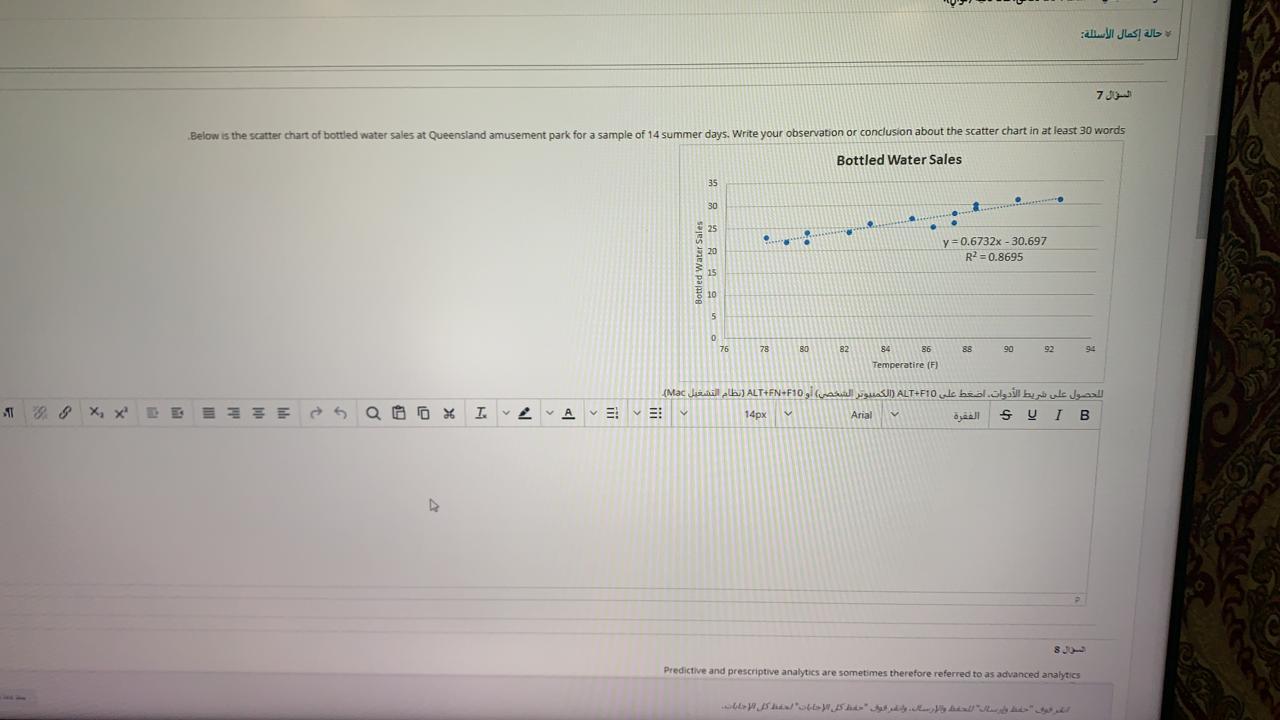
Question: Explain the graph , very quickly please 7 Below is the scatter chart of bottled water sales at Queensland amusement park for a sample of

Explain the graph , very quickly please 7 BelowExplain the graph , very quickly please

7 Below is the scatter chart of bottled water sales at Queensland amusement park for a sample of 14 summer days. Write your observation or conclusion about the scatter chart in at least 30 words Bottled Water Sales 35 30 25 . . 20 y = 0.6732 - 30,697 R2 = 0.8695 10 5 76 78 80 82 86 90 92 94 Temperatire (F) = = = = ALT + F10 ALT + FN + F10 ( Mac) I B 0 0 I. A = V 14px Arial 8 Predictive and prescriptive analytics are sometimes therefore referred to as advanced analytics

Step by Step Solution

There are 3 Steps involved in it

1 Expert Approved Answer
Step: 1 Unlock blur-text-image
Question Has Been Solved by an Expert!

Get step-by-step solutions from verified subject matter experts

Step: 2 Unlock
Step: 3 Unlock

Students Have Also Explored These Related General Management Questions!