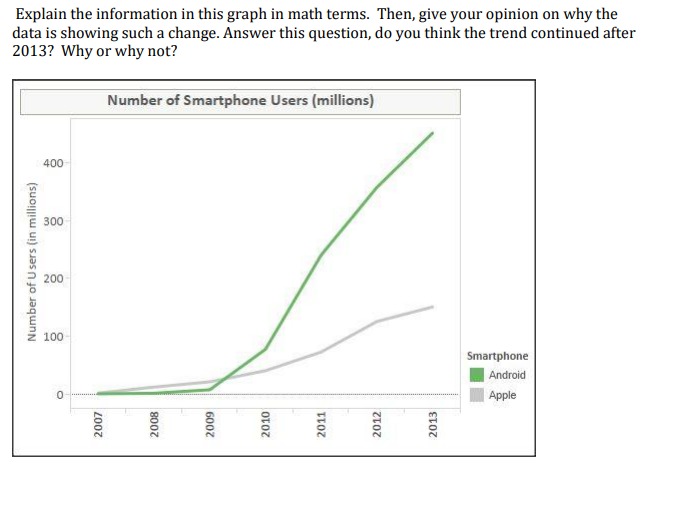
Question: Explain the information in this graph in math terms. Then, give your opinion on why the data is showing such a change. Answer this question,

Explain the information in this graph in math
Explain the information in this graph in math terms. Then, give your opinion on why the data is showing such a change. Answer this question, do you think the trend continued after 2013? Why or why not? Number of Smartphone Users (millions) 400 300 Number of Users (in millions) 200 100 Smartphone Android Apple 2010 2008 2009 2012 2013 2011 2007

Step by Step Solution

There are 3 Steps involved in it

1 Expert Approved Answer
Step: 1 Unlock blur-text-image
Question Has Been Solved by an Expert!

Get step-by-step solutions from verified subject matter experts

Step: 2 Unlock
Step: 3 Unlock

Students Have Also Explored These Related Mathematics Questions!