

Question: Explain the process Master data Transaction data . Material master . CIRS . MRP elements Organizational data SOP . Plant Revised . PIRS . Storage
Explain the process
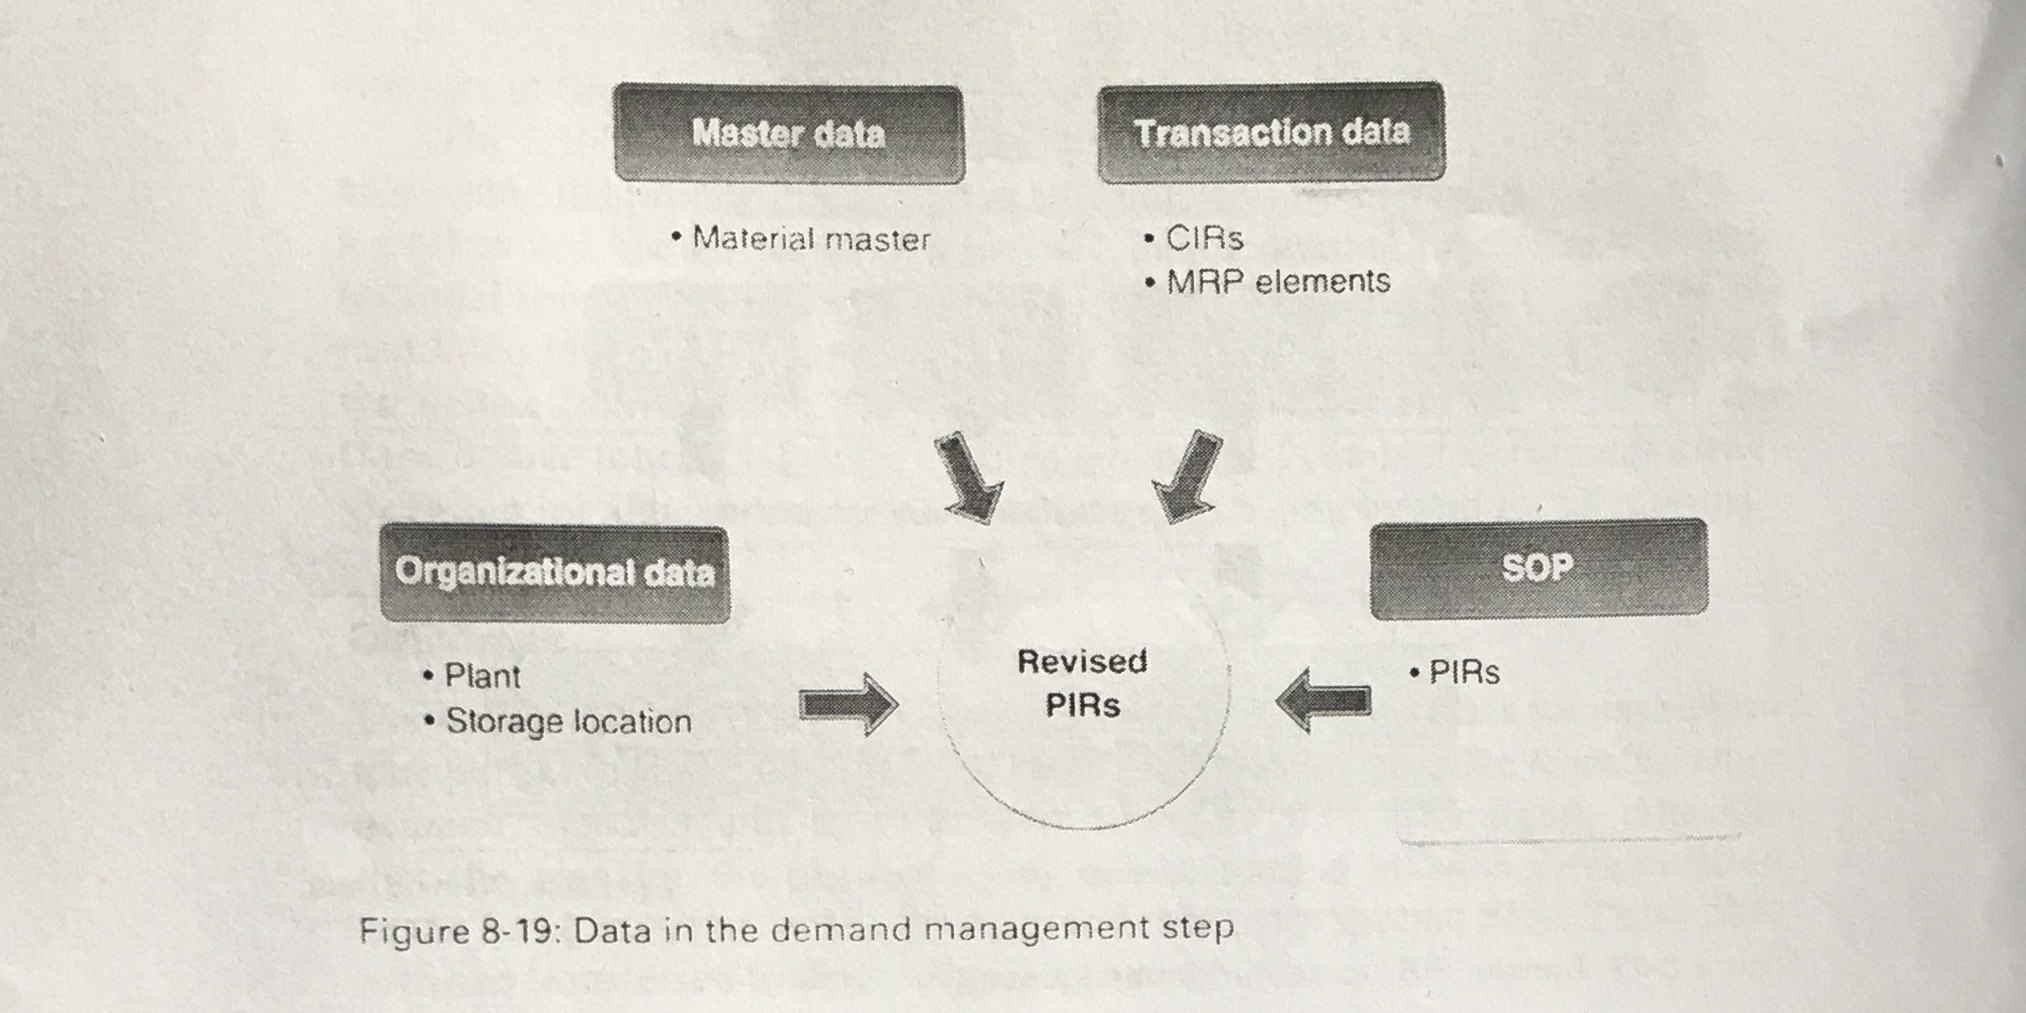
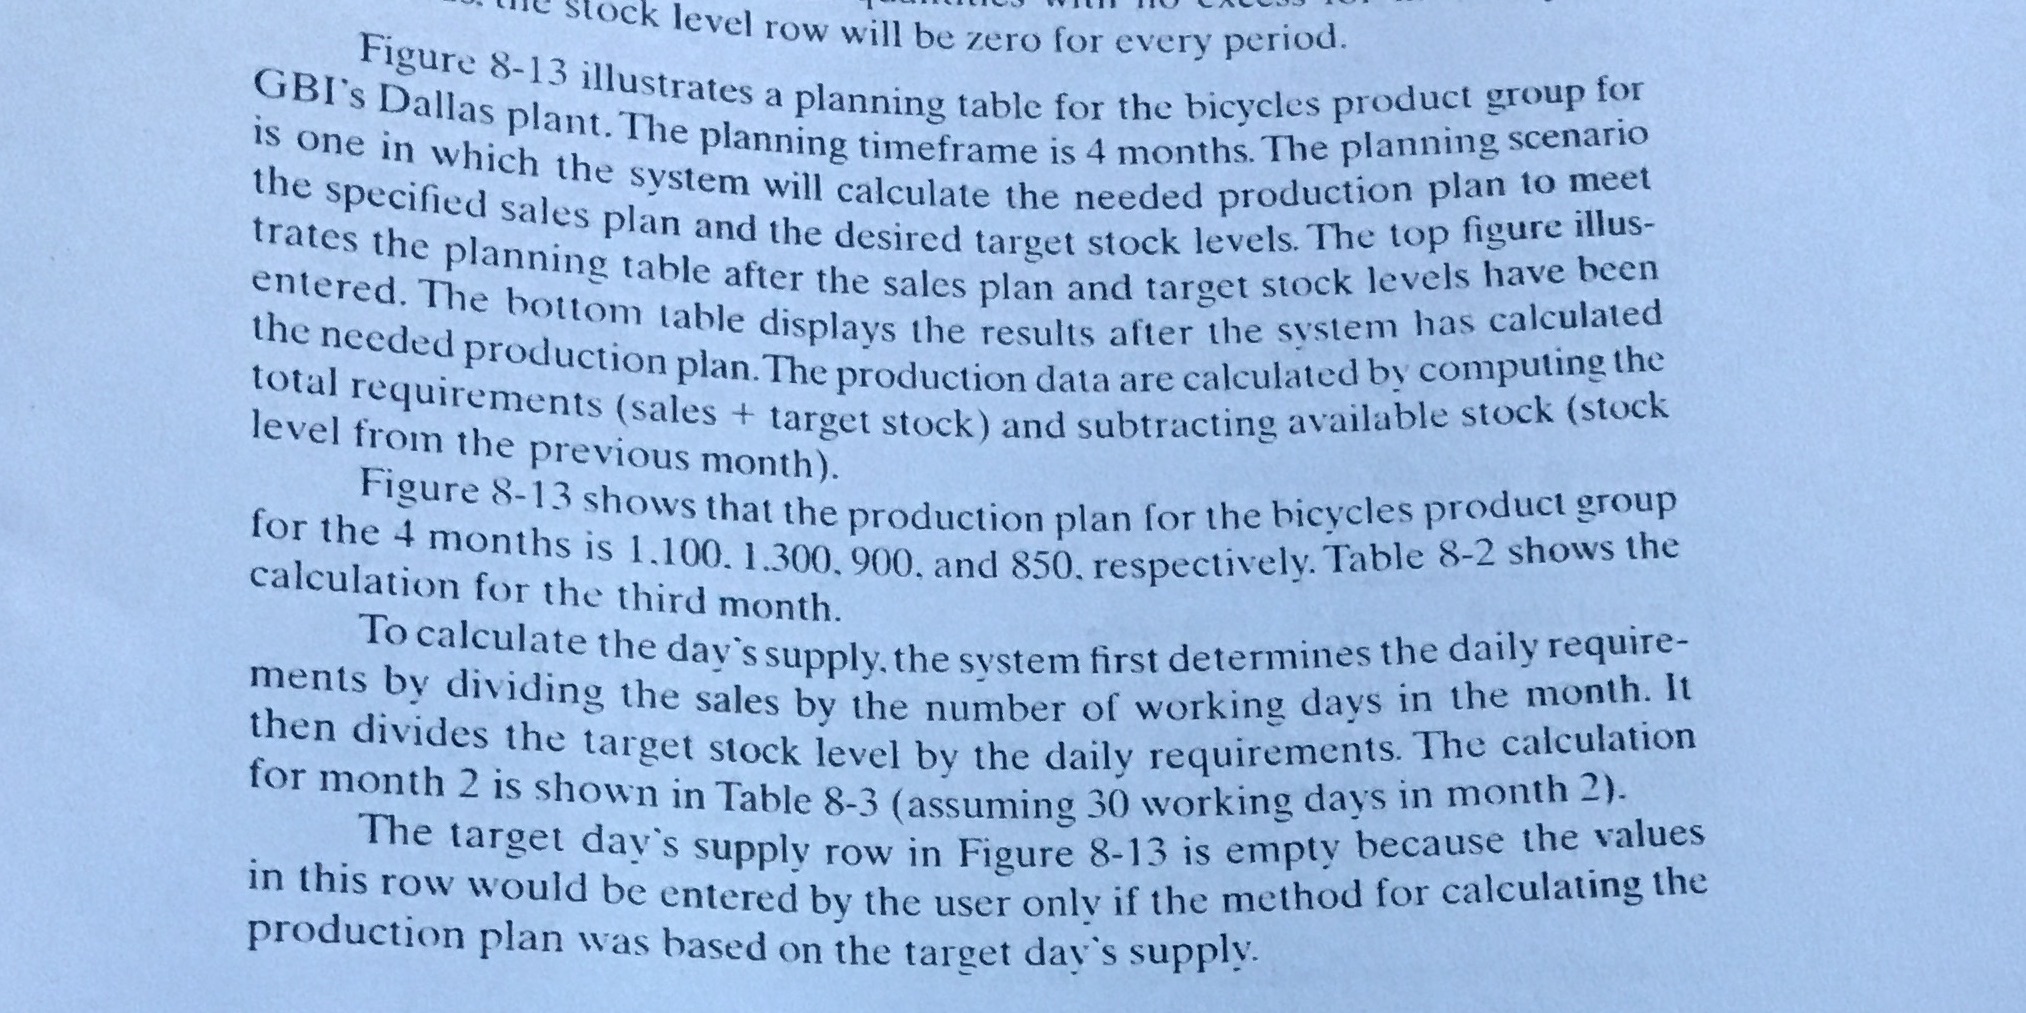
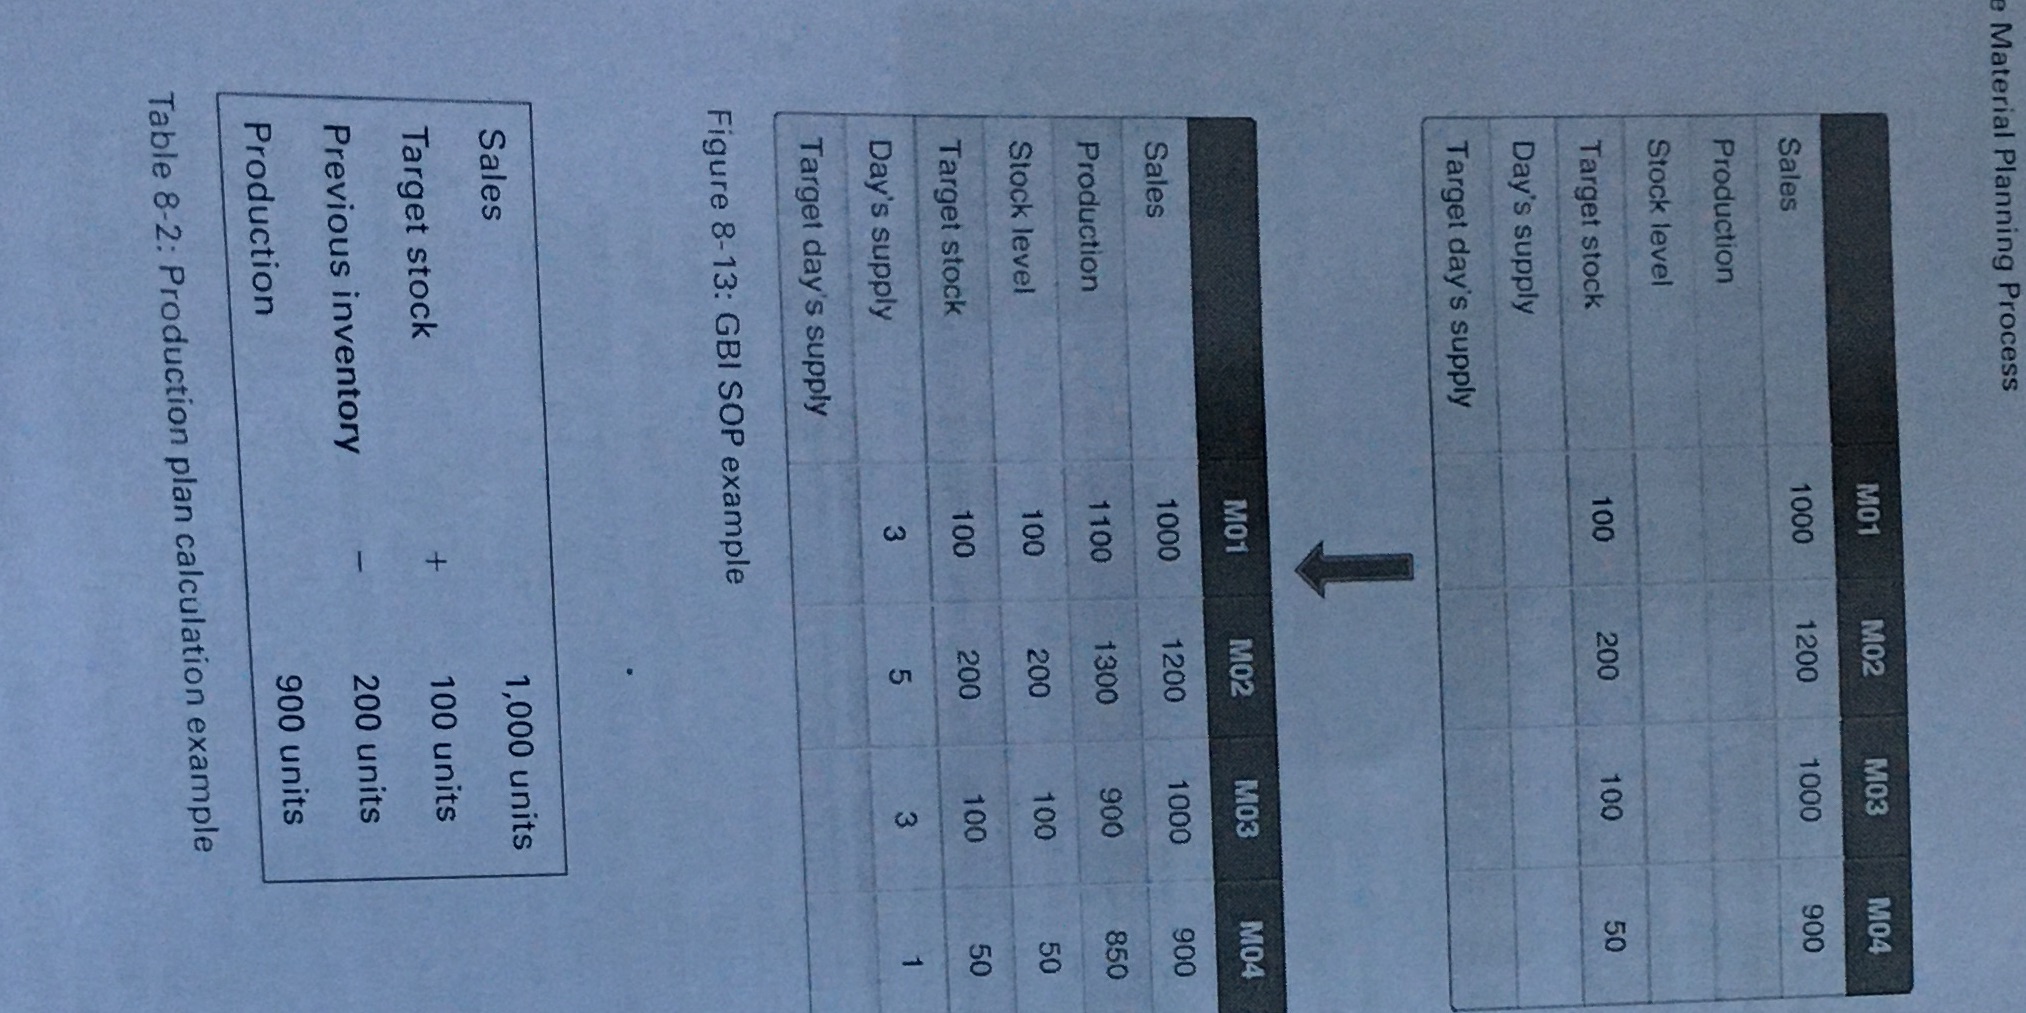
Master data Transaction data . Material master . CIRS . MRP elements Organizational data SOP . Plant Revised . PIRS . Storage location PIRS Figure 8-19: Data in the demand management stepC Stock level row will be zero for every period. Figure 8-13 illustrates a planning table for the bicycles product group for GBI's Dallas plant. The planning timeframe is 4 months. The planning scenario is one in which the system will calculate the needed production plan to meet the specified sales plan and the desired target stock levels. The top figure illus- trates the planning table after the sales plan and target stock levels have been entered. The bottom table displays the results after the system has calculated the needed production plan. The production data are calculated by computing the total requirements (sales + target stock ) and subtracting available stock (stock level from the previous month). Figure 8-13 shows that the production plan for the bicycles product group for the 4 months is 1.100. 1.300, 900, and 850. respectively. Table 8-2 shows the calculation for the third month. To calculate the day's supply. the system first determines the daily require- ments by dividing the sales by the number of working days in the month. It then divides the target stock level by the daily requirements. The calculation for month 2 is shown in Table 8-3 (assuming 30 working days in month 2). The target day's supply row in Figure 8-13 is empty because the values in this row would be entered by the user only if the method for calculating the production plan was based on the target day's supply.Material Planning Process M01 M02 M03 M04 Sales 1000 1200 1000 900 Production Stock level Target stock 100 200 100 Day's supply Target day's supply M01 MO2 M03 M04 Sales 1000 1200 1000 900 Production 1100 1300 900 850 Stock level 100 200 100 Target stock 100 200 100 Day's supply LO Target day's supply Figure 8-13: GBI SOP example Sales 1,000 units Target stock + 100 units Previous inventory - 200 units Production 900 units Table 8-2: Production plan calculation example
Step by Step Solution
There are 3 Steps involved in it

Get step-by-step solutions from verified subject matter experts