

Question: Explain the table Category N p- Correlation value Interpretation Decision of Students ept 160 .224** 0.004 Significant Covid Liteacy p>0.05 not significant N= number of
Explain the table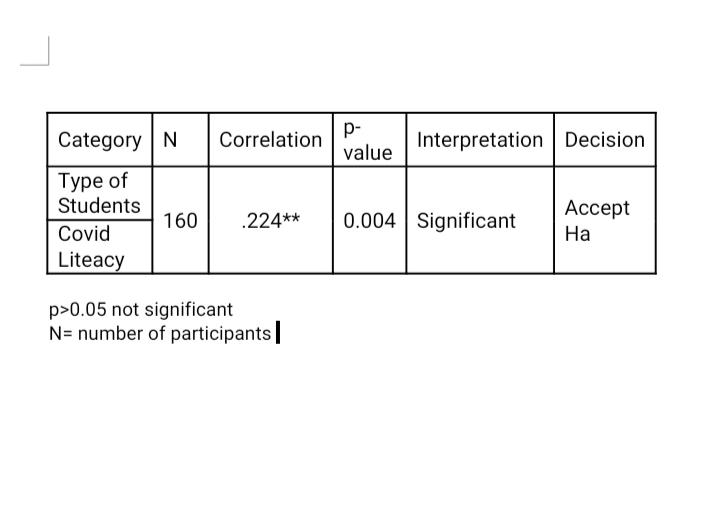
Category N p- Correlation value Interpretation Decision of Students ept 160 .224** 0.004 Significant Covid Liteacy p>0.05 not significant N= number of participants|
Step by Step Solution
There are 3 Steps involved in it
1 Expert Approved Answer
Step: 1 Unlock

Explain the table The level of statistical significance is often expressed as a pvalue between 0 and ... View full answer
Question Has Been Solved by an Expert!
Get step-by-step solutions from verified subject matter experts
Step: 2 Unlock
Step: 3 Unlock