

Question: Explain Using Expected NPV, Standard Deviation and Coefficient of Variation Figure 13-6 Scenario Analysis: Expected NPV and Its Risk (Dollars in Thousands) 0 Predicted Cash
Explain Using Expected NPV, Standard Deviation and Coefficient of Variation
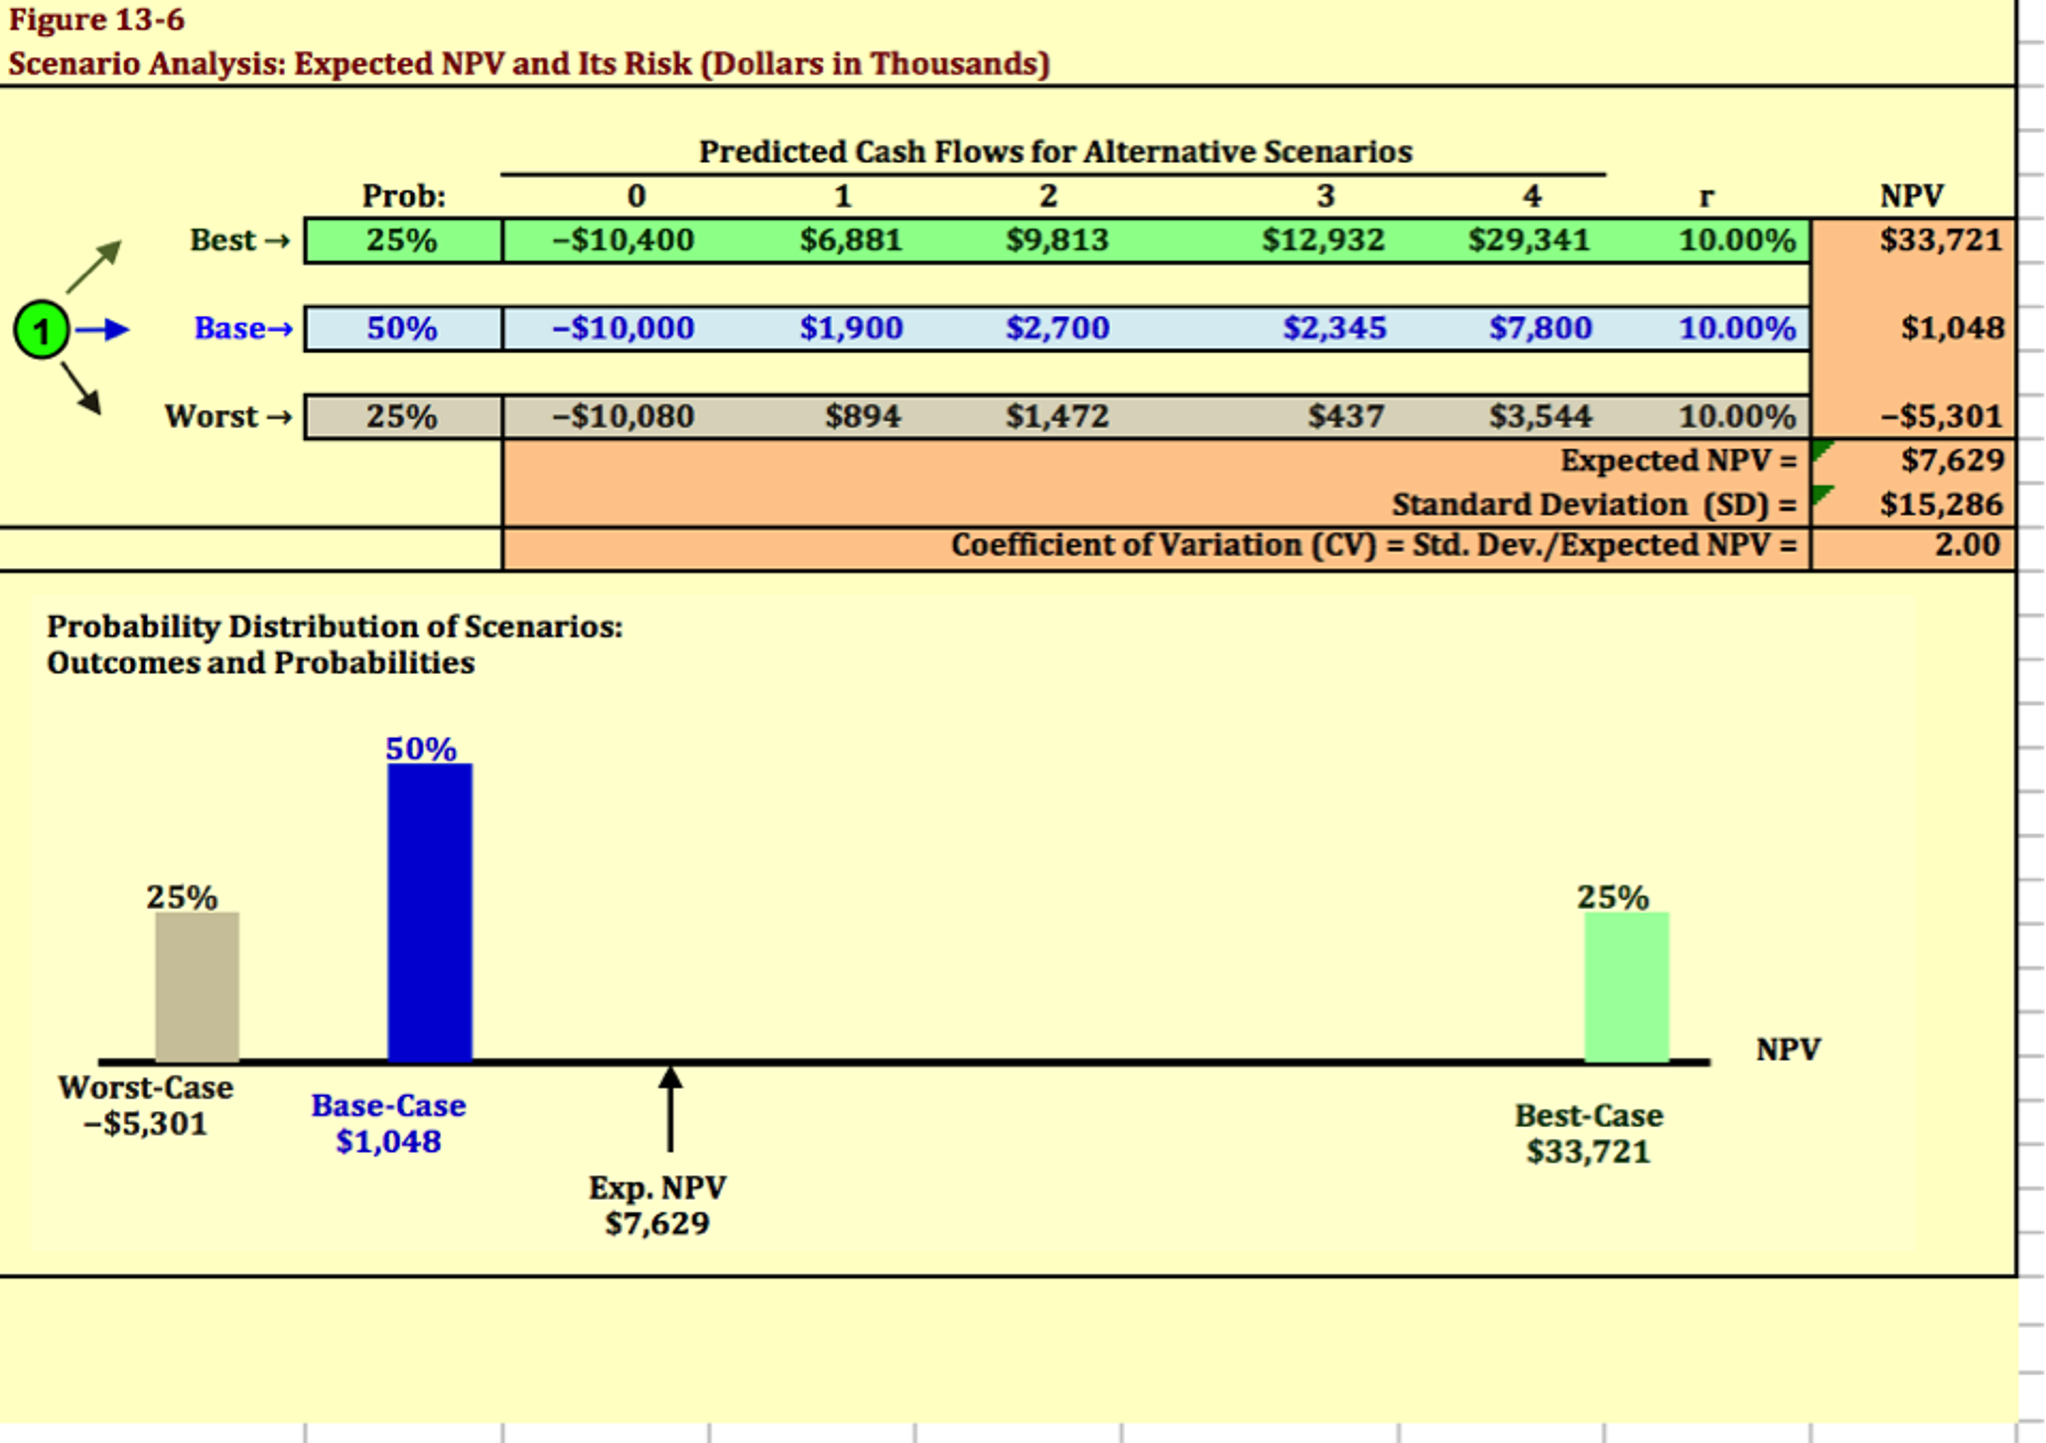
Figure 13-6 Scenario Analysis: Expected NPV and Its Risk (Dollars in Thousands) 0 Predicted Cash Flows for Alternative Scenarios 2 3 Prob: 0 NPV 5 0 3 $6,881 $1,900 $894 St | $10,400 $10,000 $10,080 $9,813 $2,700 $1,472 $12,932 $2,345 $437 $29,341 $7,800 $3,544 Best 25% 10.00% $33,721 1) Base 50% 10.00% $1,048 worst $5,301 $7,629 $15,286 2.00 25% 10.00% Expected NPV Standard Deviation (SD) Coefficient of Variation (CV) = Std. Dev/Expected NPV = 7 0 Probability Distribution of Scenarios: Outcomes and Probabilities 50% 25% 25% NPV Worst-Case $5,301 6 Base-Case $1,048 1 Best-Case $33,721 1 Exp. NPV $7,629 9
Step by Step Solution
There are 3 Steps involved in it

Get step-by-step solutions from verified subject matter experts