

Question: Explain what does the plot shows? X attach(X) m m m newdata predict (m, newdata) # visualize: plot(X, col = 1:1000 %in% m$index + 1,
Explain what does the plot shows?
X
attach(X)
m
m
m
newdata
predict (m, newdata)
# visualize:
plot(X, col = 1:1000 %in% m$index + 1, xlim = c(-5,5), ylim=c(-5,5))
points(newdata, pch = "+", col = 2, cex = 5)
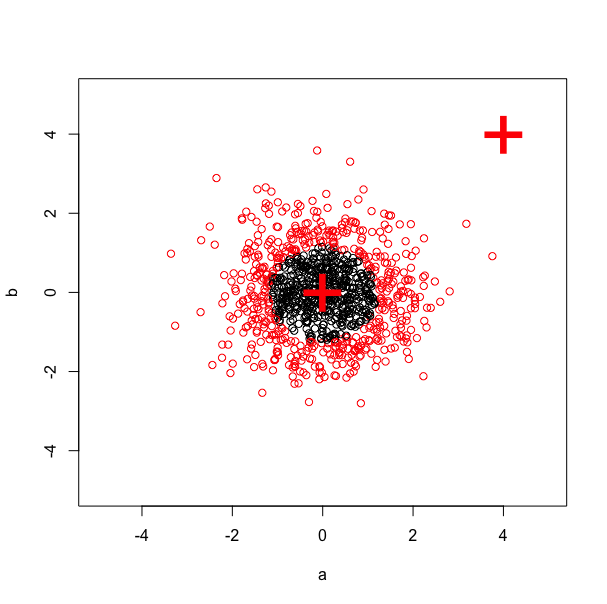
4 + N b 0 -2 -4 -4 -2 0 2 4 a 4 + N b 0 -2 -4 -4 -2 0 2 4 a
Step by Step Solution
There are 3 Steps involved in it
1 Expert Approved Answer
Step: 1 Unlock

Question Has Been Solved by an Expert!
Get step-by-step solutions from verified subject matter experts
Step: 2 Unlock
Step: 3 Unlock