

Question: Explain what is happening on the graph. 2. Explain what is the overall annual income for females in Toronto and the overall percentage of households
Explain what is happening on the graph. 2. Explain what is the overall annual income for females in Toronto and the overall percentage of households with no child in Toronto (the data you have will help explain what is happening but you need other sources to help explain why these patterns are occurring.
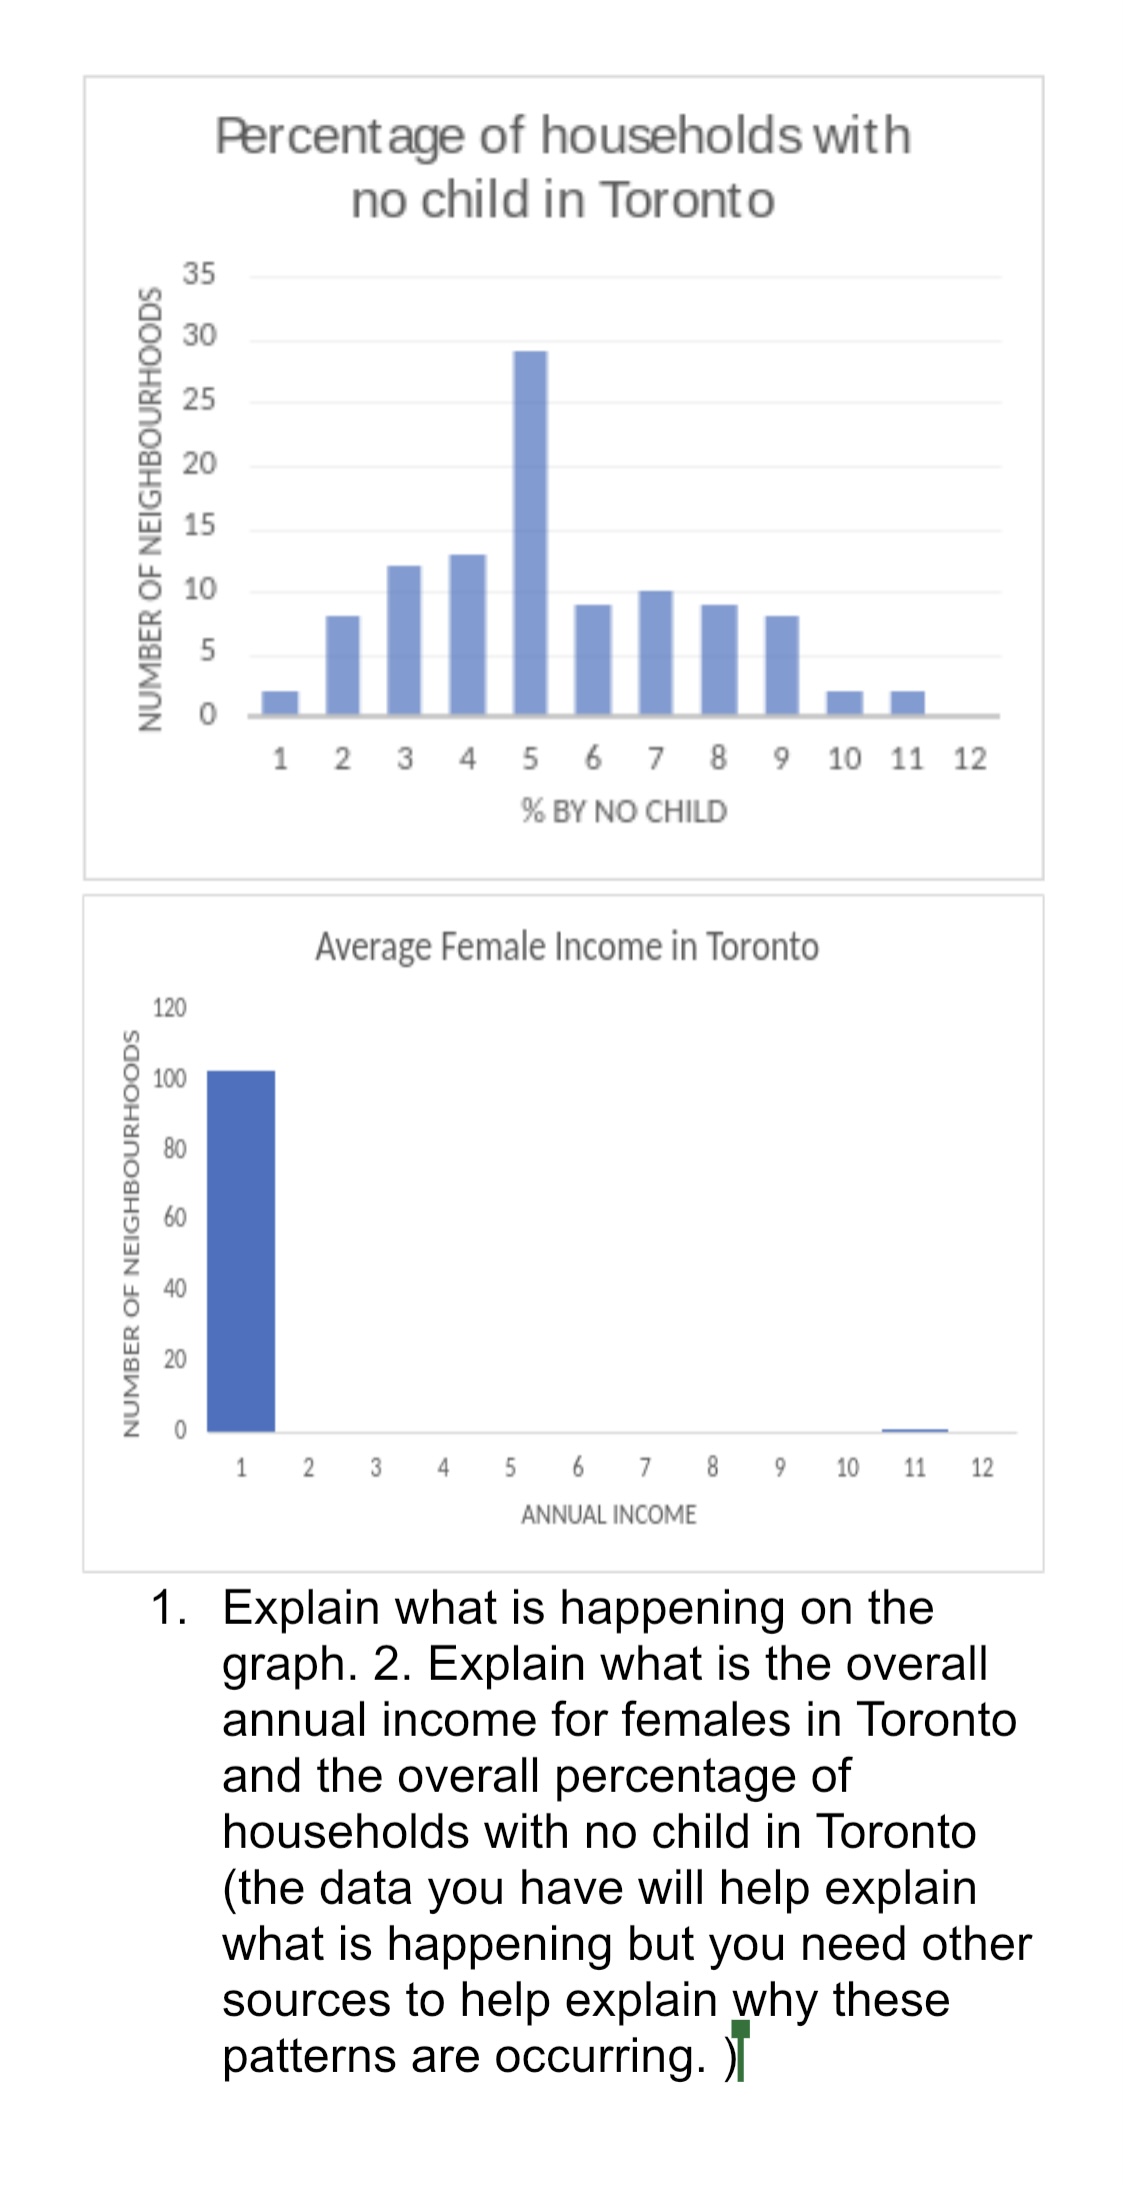
Percentage of households with no child in Toronto 35 30 25 NUMBER OF NEIGHBOURHOODS 1 2 3 4 5 6 7 8 9 10 11 12 % BY NO CHILD Average Female Income in Toronto 120 100 80 60 NUMBER OF NEIGHBOURHOODS 40 20 0 1 2 3 4 5 6 7 8 9 10 11 12 ANNUAL INCOME 1. Explain what is happening on the graph. 2. Explain what is the overall annual income for females in Toronto and the overall percentage of households with no child in Toronto (the data you have will help explain what is happening but you need other sources to help explain why these patterns are occurring. )I
Step by Step Solution
There are 3 Steps involved in it

Get step-by-step solutions from verified subject matter experts